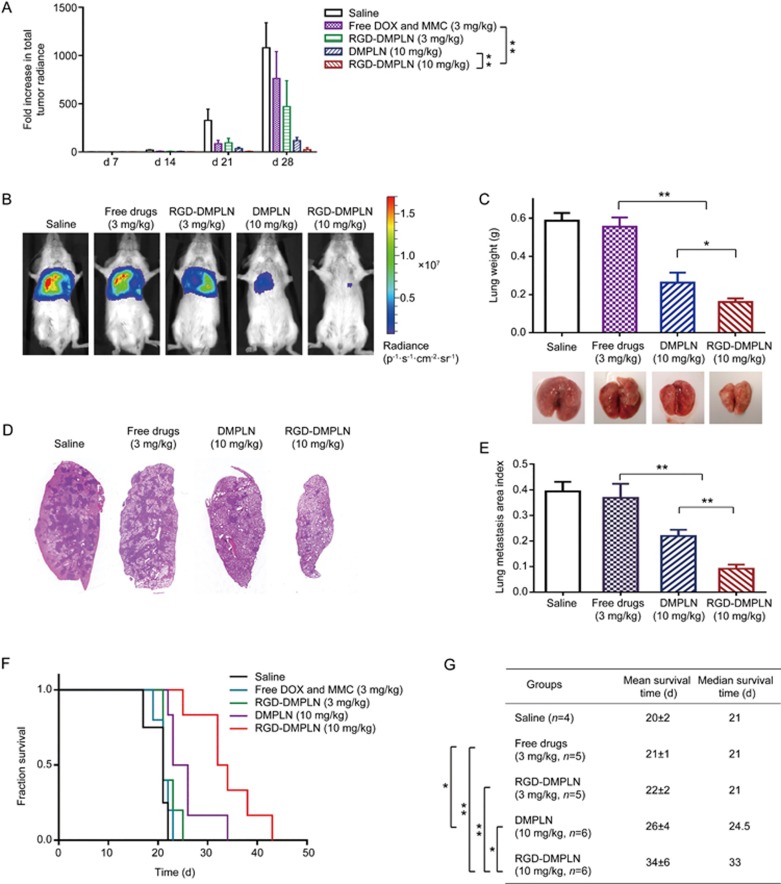
Figure 6.
Inhibition of MDA-MB-231-luc-D3H2LN lung metastasis growth and extension of animal survival. (A) Quantification of tumor burden measured using bioluminescent imaging once a week. Treatments of saline (n=4), free DOX and MMC (3 mg/kg DOX, n=5), RGD-DMPLN (3 mg/kg DOX, n=5), DMPLN (10 mg/kg DOX, n=6), RGD-DMPLN (10 mg/kg DOX, n=6) were given intravenously via the tail vein one week after tumor inoculation. (B) Representative in vivo bioluminescent images of mice from each treatment group on d 28 after tumor inoculation. (C) Average weight and representative images of excised lungs on d 28. Data represents mean±SD. n=4. (D) Representative histological images of H&E stained left lungs at d 28. The dark purple regions represent metastatic nodules. (E) Quantification of metastases by lung metastasis area index (n=9 for each group). (F) Kaplan-Meier plot of the tumor-bearing mice for all groups. (G) Mean and median survival time of the tumor-bearing mice. All data were presented as mean±SD. **P<0.01.

