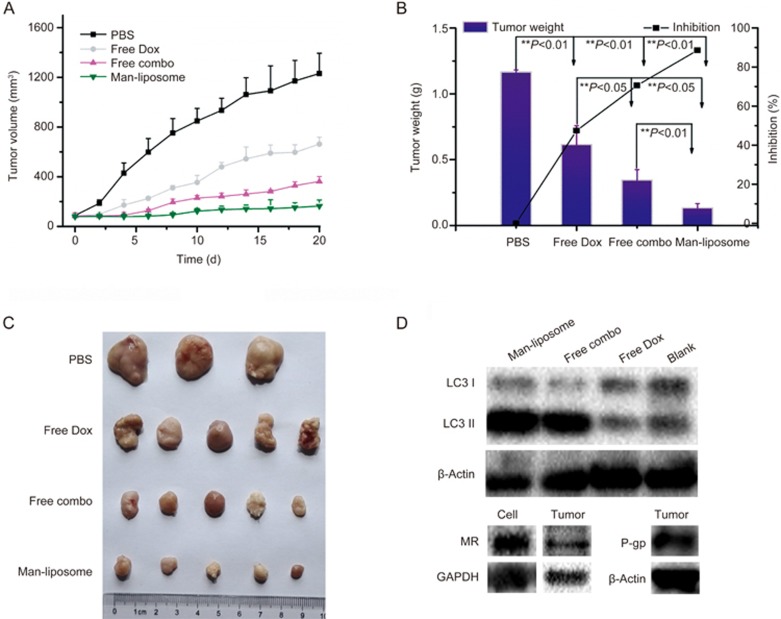
Figure 11.
The anti-tumor effect on HCT8/ADR tumor bearing nude mice. (A) Tumor volume growth curves. (B) The weights of tumors at the end of different treatments. (C) The photographs of tumors at the end of different treatments. (D) The MR, P-gp expression on HCT8/ADR tumors and cells, and the expression of LC3 of HCT8/ADR cells after different treatments. *P<0.05, **P<0.01.

