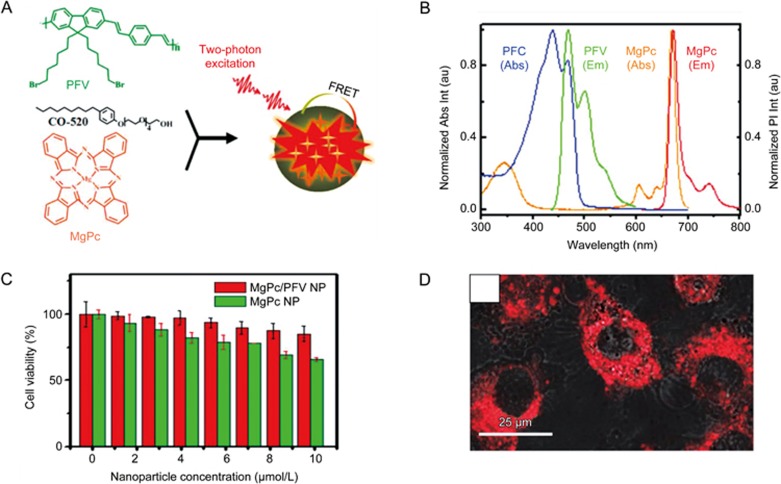
Figure 3.
(A) Schematic preparation procedures of MgPc/PFV NPs. (B) Normalized absorption and emission spectra of PFV NPs and MgPc NPs. (C) In vitro cytotoxicity of HepG2 cancer cells treated with MgPc/PFV NPs and MgPc NPs containing the same amount of MgPc for 8 h. (D) TP fluorescent image of HepG2 cancer cells treated with MgPc/PFV NPs. The scale bar is 25 μm. Reproduced with permission from Ref 67.

