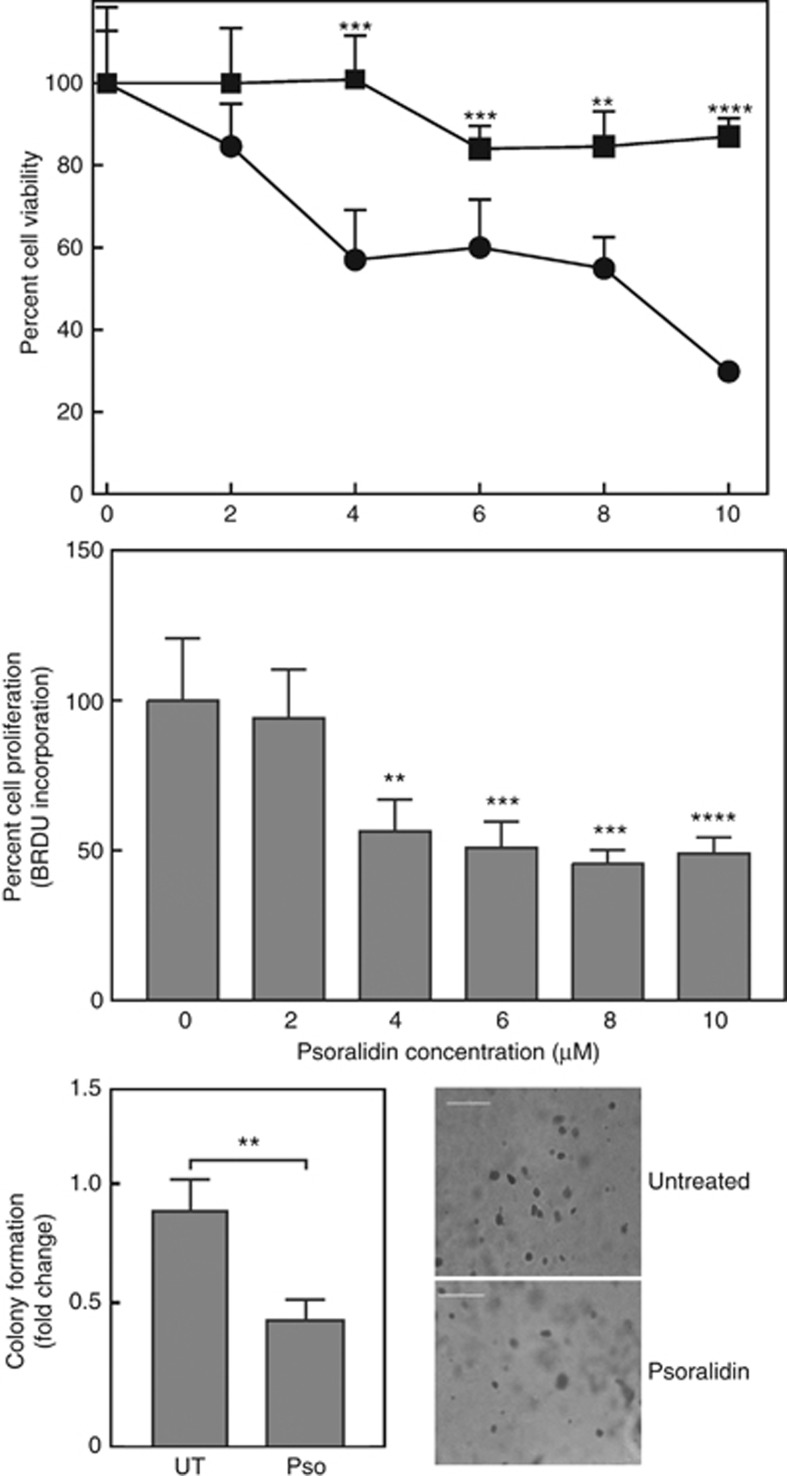
Figure 1.
Psoralidin cytotoxicity in RWPE-1 and CTPE cells. (upper panel) RWPE-1 and CTPE cells were treated with vehicle (DMSO; square) or the indicated concentrations of Pso (circle) for 24 h and cell viability determined. (middle panel) Cell proliferation was assessed by BrdU incorporation in CTPE cells treated with indicated concentrations of Pso. Data are expressed as mean±s.d. of two independent experiments done in triplicate. (lower panels) To assess anchorage-independent growth, CTPE (1 × 10³) cells were grown in soft agar with or without Pso for 10–15 days. Colonies were stained with crystal violet and counted manually. Student’s t-test was used to calculate statistical significance between vehicle control and treatment at each concentration. **P<0.01, ***P<0.001, ****P<0.0001.

