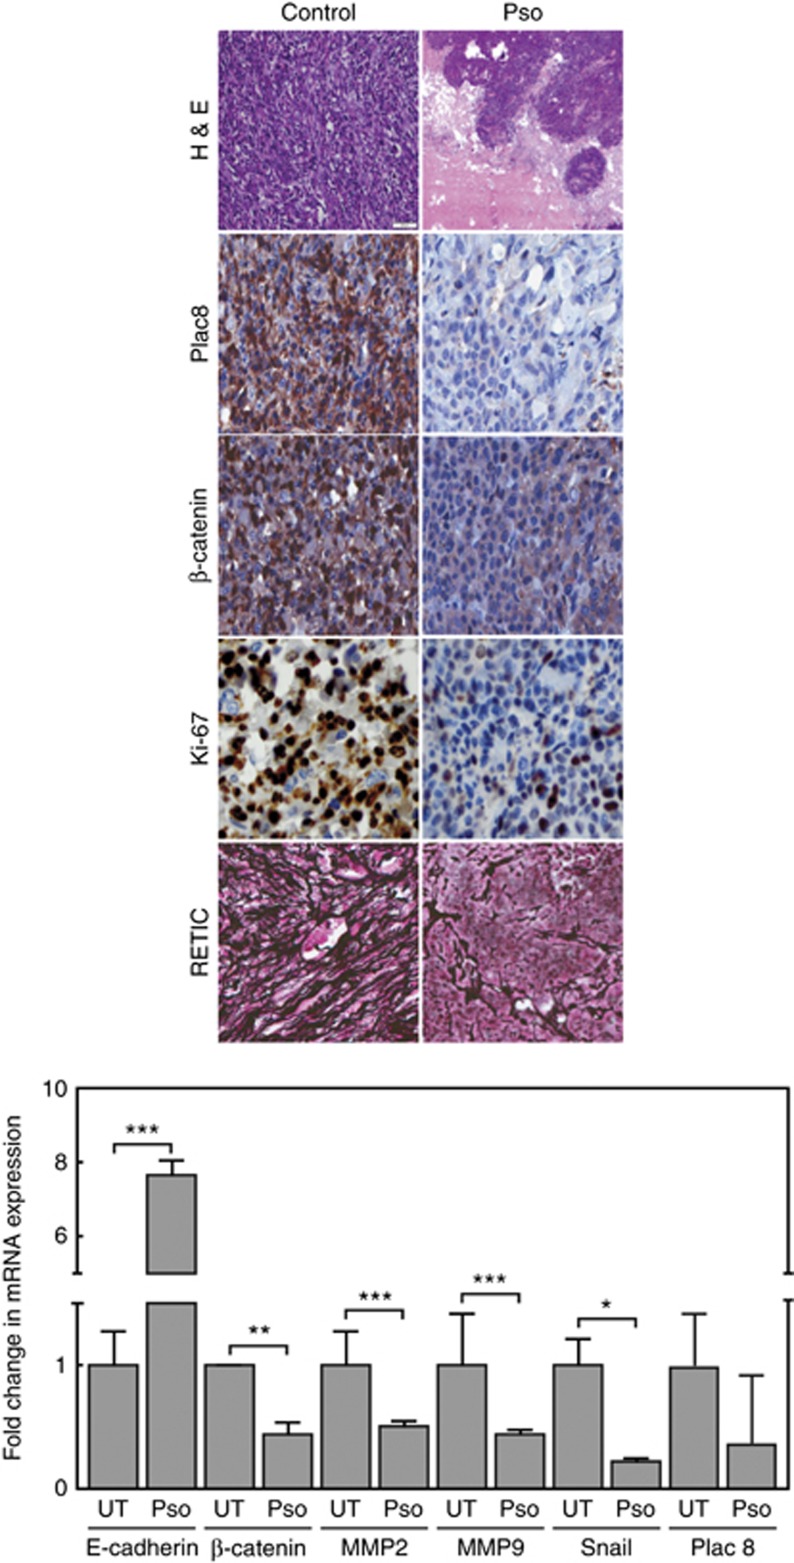
Figure 6.
(upper panel) Vehicle and Pso-treated tumour tissues were processed for H &E and immunohistochemical staining for Plac8, β-catenin, Ki-67 and RETIC. Total of 300–400 cells were counted for positive cells and represented in Supplementary Table 1 as average number of positive cells. (lower panel) qRT-PCR was performed to measure differences between the steady-state levels of expression of EMT markers in CTPE tumours from Pso-treated and -untreated animals. Student’s t-test was used to calculate statistical significance between Pso-treated and -untreated tumours at each time point *P<0.05, **P<0.01, ***P<0.001.

