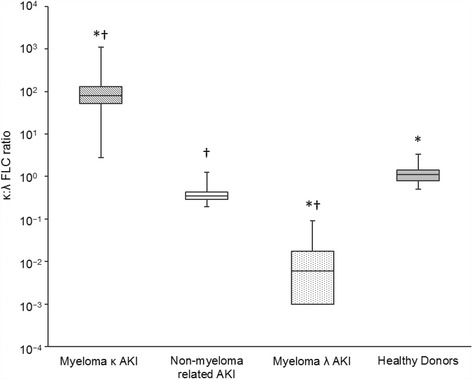
Fig. 2.

Serum κ:λ FLC ratio analysed using Seralite®. Data is shown for patients with multiple myeloma (with either a monoclonal κ or λ FLC) and acute kidney injury (AKI), patients with AKI without myeloma (non-myeloma related AKI) and healthy donors. Boxes show the interquartile range, with the line indicating the median, and the whiskers show the minimum and maximum. * indicates a significant difference to the non-myeloma related AKI group; † indicates a significant difference to healthy donors; p < .05 for all comparisons
