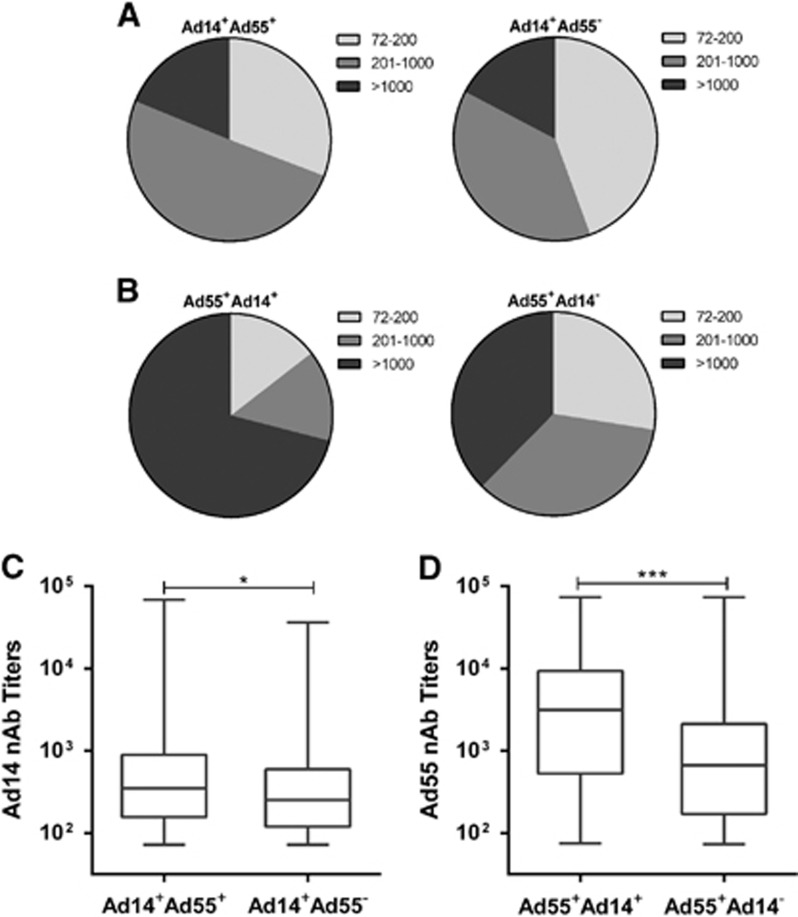
Figure 6.
Profiling of the seropositive rates and nAb levels in single- and double-positive blood donors. (A) The distributions of Ad14-seropositive donors with different nAb titers in Ad55-seropositive or seronegative groups. (B) The distributions of Ad55-seropositive donors with different nAb titers in Ad14-seropositive or seronegative groups. The difference between the groups was analyzed by χ2-test. The overall Ad14 (C) and Ad55 (D) nAb levels in single- or double-positive groups are also shown. The comparison between groups was performed by Mann–Whitney test, and a P-value <0.05 was considered statistically significant. *P<0.05; ***P<0.001.

