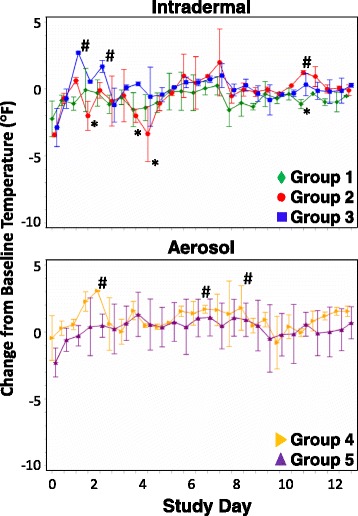
Fig. 1.

Change from baseline body temperature following challenge of CMs with CHIKV. Body temperatures of CMs challenged by ID inoculation (top graph) or by aerosol (bottom graph) were recorded twice daily for 13 days. Mean changes from baseline temperature are shown with standard normal 95% confidence intervals for each group. * - group mean temperature significantly decreased compared to baseline count at 0.05 level; # - group mean temperature significantly increased compared to baseline count at 0.05 level
