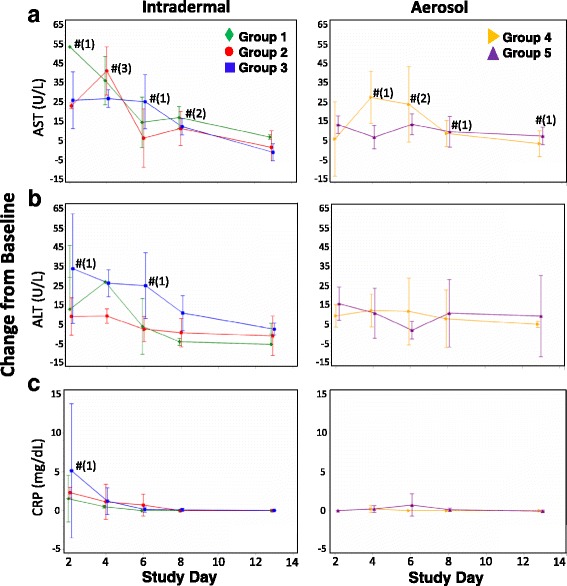
Fig. 4.

Change from baseline in clinical chemistry parameters following challenge of CMs with CHIKV. Concentrations of a AST, b ALT, and c CRP in CMs challenged by ID inoculation (left graphs) or by aerosol (right graphs) were determined on days 2, 4, 6, 8, and 13 post-challenge. Mean changes from baseline parameter concentrations are shown with standard normal 95% confidence intervals for each group. * - group mean parameter significantly decreased compared to baseline at 0.05 level; # - group mean parameter significantly increased compared to baseline at 0.05 level; numbers in parentheses represent the number of groups significantly different from baseline at that time point
