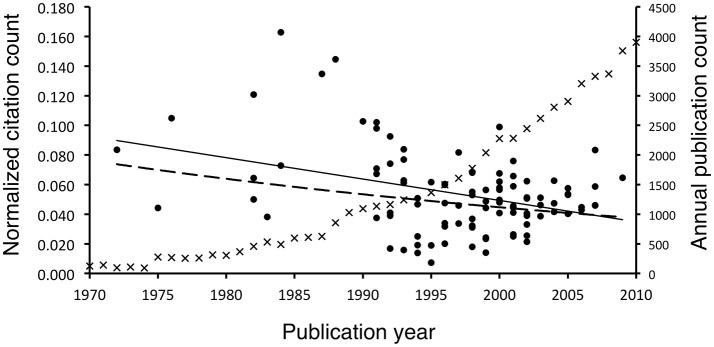
Figure 3.
Plot of normalized citation count of the 100 most-cited neuroscience articles and annual neuroscience publication count against publication year. Each normalized citation count point was represented by a dot. It positively correlated (r2 = 0.373, p < 0.001) with years since publication (i.e., negatively correlated with publication year). The growth fitted a linear trend (dashed line, r2 = 0.14) better than an exponential trend (solid line, r2 = 0.06). For illustrative purpose, the annual count of neuroscience publications during the same period was plotted (each data was represented by a cross). It experienced an exponential growth (y = 3 × 10−77e0.0919x). Data were retrieved from searching “neuro*” in the PubMed database.

