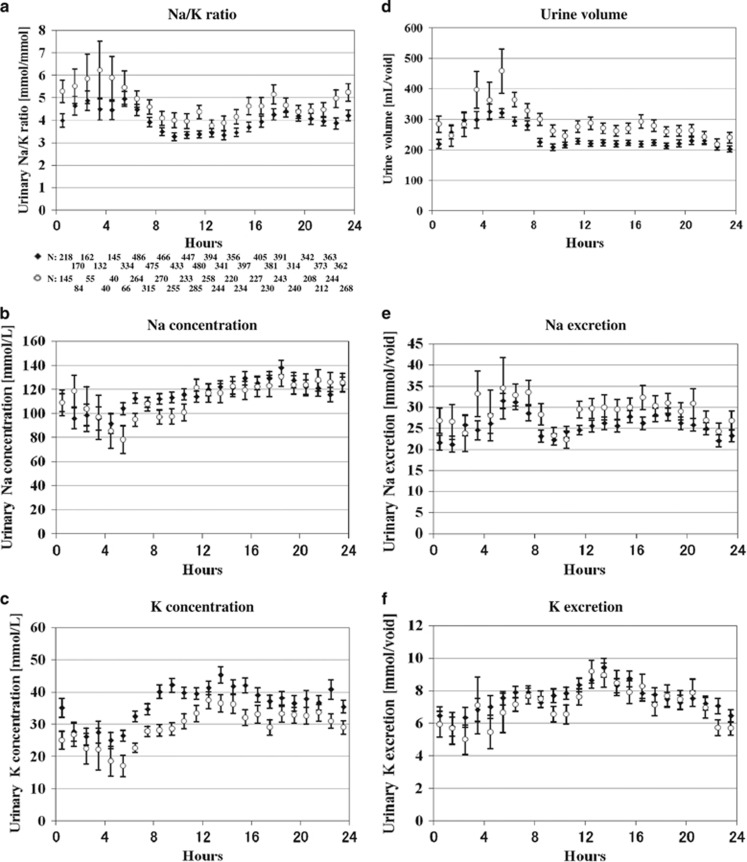
Figure 2.
Overall hourly mean values of casual urinary variables in subgroups of normotensive and hypertensive individuals (urine specimens, N=13 277); Characteristics of the Na/K ratio, Na and K concentrations, urine volume, Na and K excretions were similar among subgroups of normotensive (♦ N=45) and hypertensive (○ N=77) (a–f). Bars indicate 95% confidence interval of the mean.

