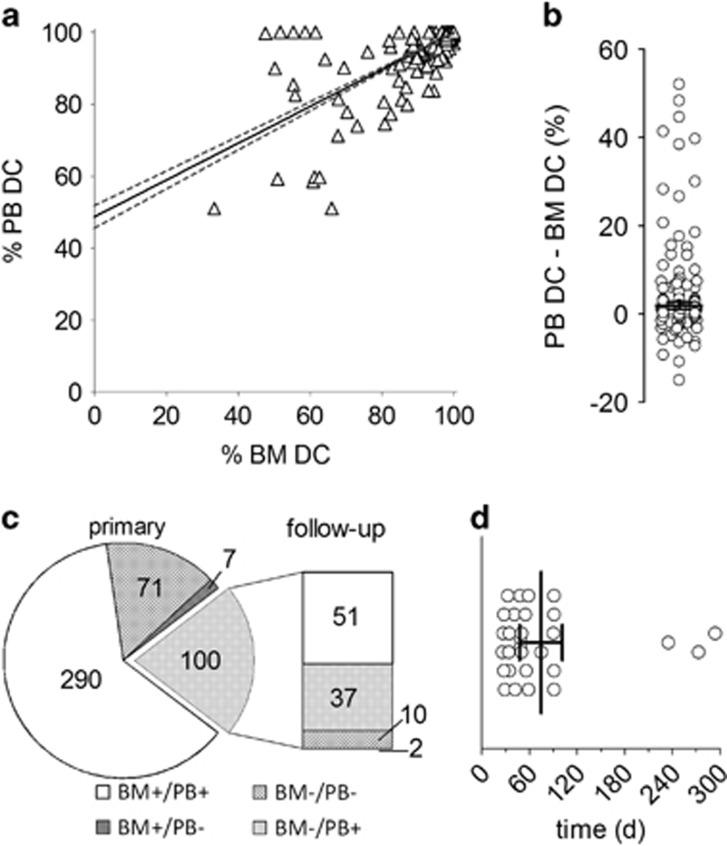
Figure 1.
Correlation between BM and PB DC. (a) Scatter plot of DC results for 825 matched BM and PB obtained by real-time qPCR. Note that 513 data points are located at 100% PB/100% BM DC. The linear trend for the overall correlation is depicted by a solid line, the 95% confidence interval of the regression by dotted lines. (b) Scatter dot plot of differences between PB and BM DC for the 312 samples (825 excluding 513 samples with 100% BM and 100% PB DC). The mean difference with 95% confidence interval is indicated by the horizontal line. (c) Chimerism status in 468 matched sample pairs with available chimerism data from the next follow-up visit. The pie chart indicates the number of cases in each of the four categories depicted (+, complete DC; −, incomplete DC) for the primary sample pairs, the bar graph represents the corresponding follow-up sample pairs. (d) Duration of complete PB DC/incomplete BM DC mismatch status for the 37 samples with persisting DC incongruences. Duration of the mismatch between sample pairs with multiple consecutive disparate diagnoses was totaled. The mean duration with 95% confidence interval is indicated.

