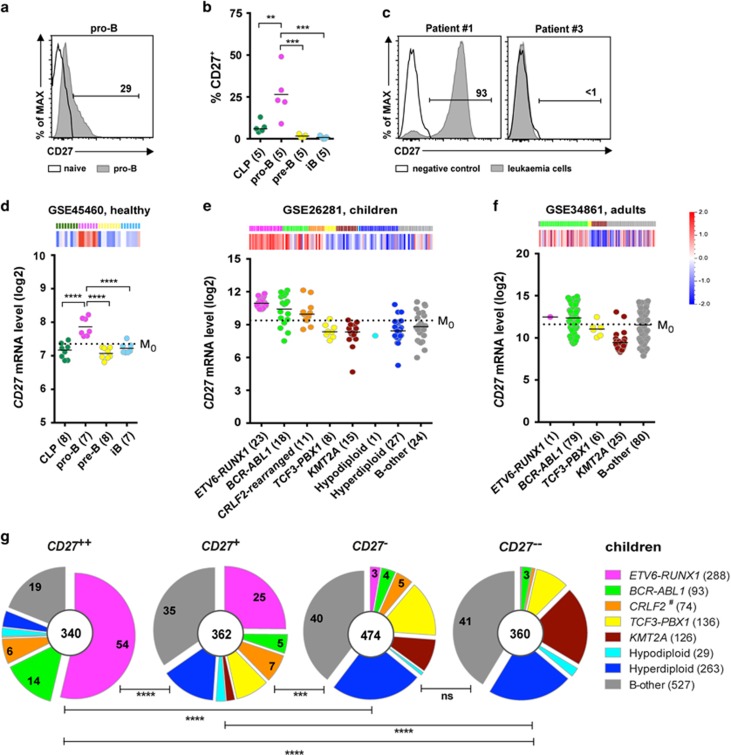
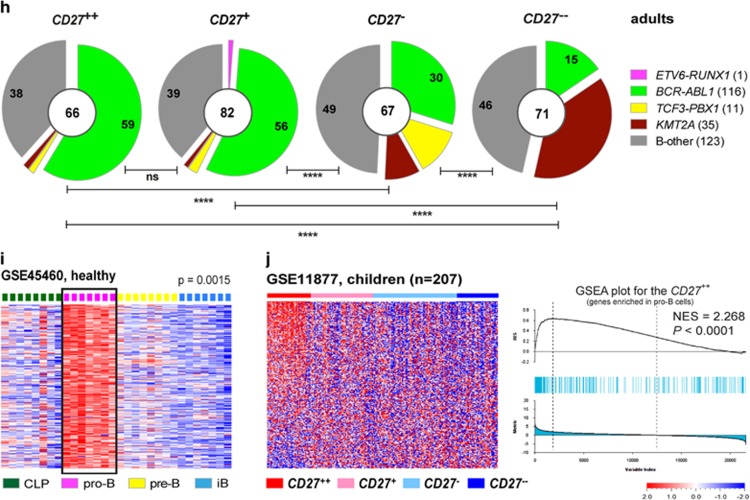
Figure 1.
Comparison of CD27 expression and molecular signature between pro-B cells and BCP-ALL. (a) Representative histogram shows surface CD27 expression in pro-B cells. (b) Scatter plot shows percentages of CD27+ cells in indicated subsets of BM samples from five healthy donors. (c) Representative histograms show CD27 surface expression in two BCP-ALL samples (CD27+ and CD27−). (d, e, f) Heat maps and scatter plots show CD27 mRNA expression levels in (d) healthy (GSE45460) BM; (e) pediatric (GSE26281) and (f) adult (GSE34861) BCP-ALL samples. Dashed line in scatter plots represents M0. (g and h) Pie charts show the proportions of BCP-ALL subtypes within each CD27 cluster based on meta-analyzes of (g) eight pediatric data sets (GSE26281, GSE33315, GSE13576, GSE13425, GSE12995, Blood 2003, GSE11877, GSE47051) and (h) two adult data sets (GSE34861 and CCR 2005), after classifying BCP-ALL samples in each data set into four groups according to CD27 expression levels: CD27++ (>M1), CD27+ (<M1 to >M0), CD27− (<M0 to >M−1), CD27−− (<M−1). Numbers in the center of pie charts represent number of patient samples, and those in segments the proportions of the indicated subtype. M0: mean expression level of CD27 in all samples; M1: mean expression of CD27 in samples with levels above M0; M−1: mean expression of CD27 in samples with levels below M0. (i) Heat map shows genes highly expressed in pro-B cells (pro-B signature). Genes are selected according to the criteria: P-value (<0.05), q-value (<0.1) and fold change (>1.5). (j) Heat map (left) and GSEA enrichment plots (right) reveals a pro-B molecular signature in CD27++ high-risk pediatric BCP-ALL data set (GSE11877). CLP, common lymphoid progenitor; iB, immature B. #CRLF2-rearranged (previously defined) and CRLF2-high (defined herein) were pooled. Statistical analysis: (b and d) one-way ANOVA and (g and h) χ2 analysis. **P < 0.01; ***P<0.001; ****P<0.0001.


