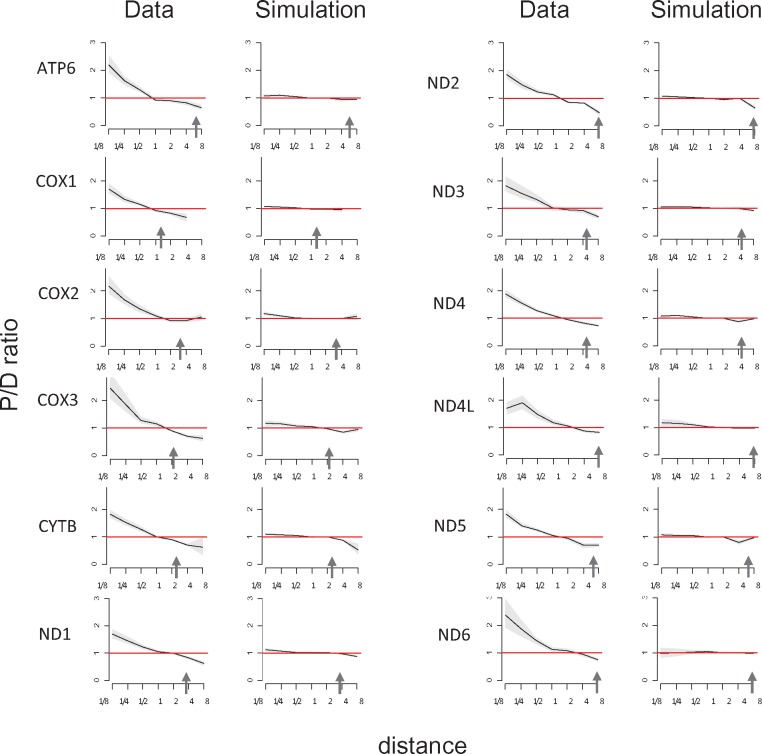
Fig. 4.—
Higher fraction of parallel substitutions between closely related species. Horizontal axis, distance between branches carrying the substitutions, measured in numbers of amino acid substitutions per site (split into bins by log2(distance)). Vertical axis, P/D ratios for substitutions at this distance. Black line, mean; grey confidence band, 95% CI obtained from 1,000 bootstrapping replicates. The red line shows the expected P/D ratio of 1. Arrows represent the distance between human and Drosophila.

