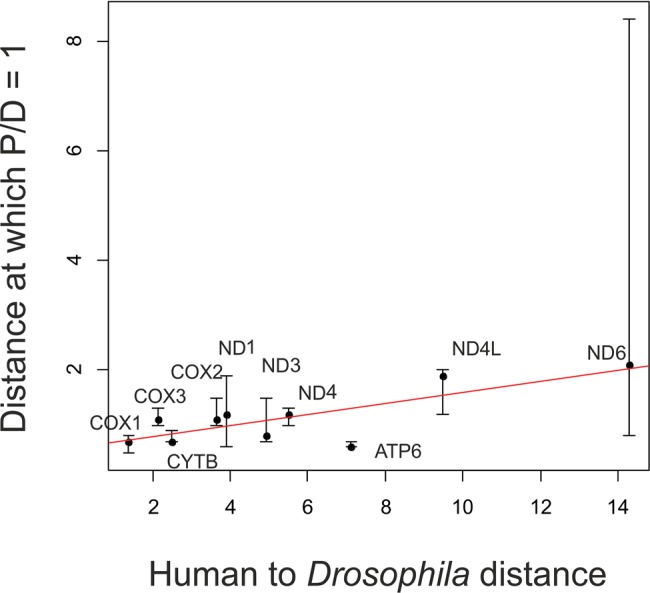
Fig. 5.—

Faster decline of the P/D ratio for rapidly evolving genes. Horizontal axis, gene-specific phylogenetic distance between Homo sapiens and Drosophila simulans. Vertical axis, phylogenetic distance at which the P/D ratio reaches 1. Each dot represents one gene, and the line represents the linear trend. Only the ten genes with available D. simulans sequences were used. Error bars correspond to the 95% CI for the distance at which the P/D ratio reaches 1, obtained by bootstrapping sites 1,000 times.
