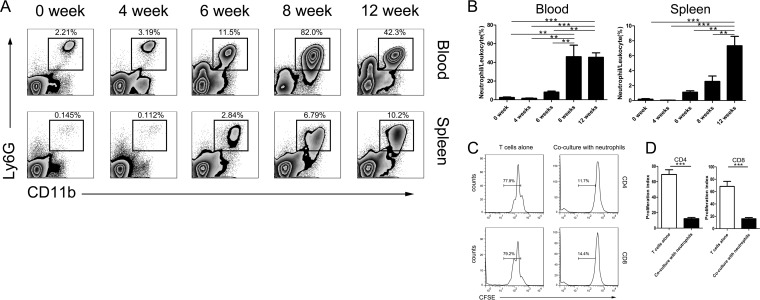
FIG 1.
Percentage of neutrophils in the white blood cell population increased postinfection. (A) Representative flow cytometry plots are shown to describe the increase in neutrophils in the blood and spleen following S. japonicum infection. Neutrophils were defined as CD45+ CD11b+ Ly6g+ Ly6c+ F4/80− and are shown as a percentage of the total white blood cell (CD45+) population. (B) Summary graphs showing the increase in neutrophils as a percentage of total white blood cells for 4 animals following infection with S. japonicum. Animals were monitored longitudinally for up to 12 weeks. **, P < 0.01; ***, P < 0.001 (by one-way ANOVA with Tukey's post hoc test). (C) CD3+ T cells were labeled with CFSE and then cultured alone or with neutrophils from S. japonicum-infected mice. Proliferation was measured as CFSE dilution after 48 h in culture. Representative CFSE dilution plots showing T cell proliferation are shown. (D) Summary graphs showing the reduction in T cell proliferation following coculture with neutrophils. Three or four samples per group were used. ***, P < 0.001 (by Student's t test).

