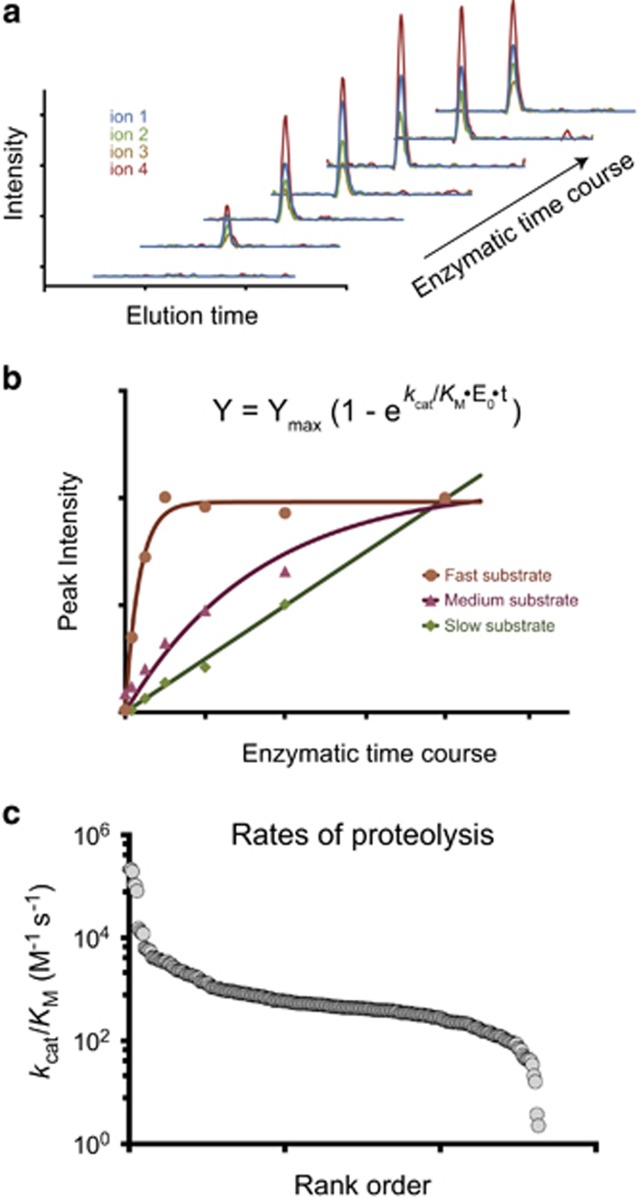
Figure 4.
Rates of proteolysis of natural caspase substrates. With the advances of mass spectrometry, using targeted LC-MS/MS has become standard practice, allowing better characterization of proteolysis in complex mixtures. (a) Chromatograms of targeted transitions in SRM or PRM methods, allowing quantification of peptides captured over a time-course experiment. (b) Rates of proteolysis can be calculated for each peptides originating from proteolytic events by plotting the sum of the peak intensities (or area) as a function of time, assuming pseudo-first-order kinetics. (c) Comparison of the estimated rates of proteolysis for each cleavage sites of each caspase substrates showing up to five order of magnitude difference. Adapted from ref. 16

