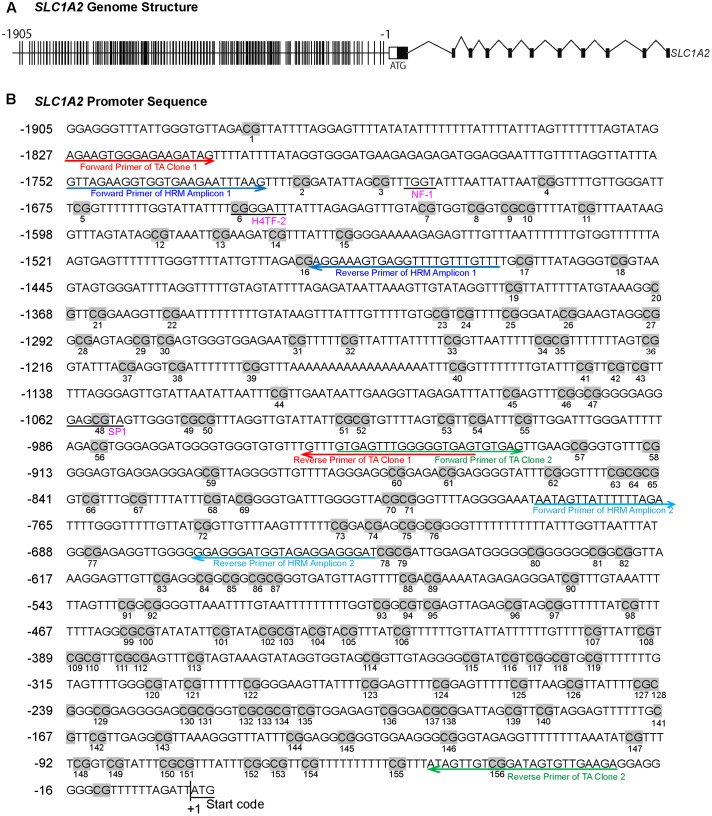
FIGURE 1.
The methylation profile of CpG sites on SLC1A2 promoter. (A) The gene structure profile of SLC1A2. Distribution of CpG sites on the proximal SLC1A2 promoter region approximately 2 kb. The individual lines in the promoter denote each CpG site. (B) Distribution of CpG sites, location of HRM and bisulfite-specific primers on the SLC1A2 promoter region. The number of individual CpG sites is shown in the picture under each CpG site, displayed in gray highlight. The putative promoter elements in the human SLC1A2 gene are shown in underlined pink text. Arrow indicates primers used in experiments to amplify the interested regions. Red arrow denotes the primers of TA Clone 1; green arrow denotes TA Clone 2; dark blue arrow denotes amplicon 1 in HRM, light blue arrow denotes amplicon 2 in HRM. All primers shown in the picture are bisulfite-specific primers.

