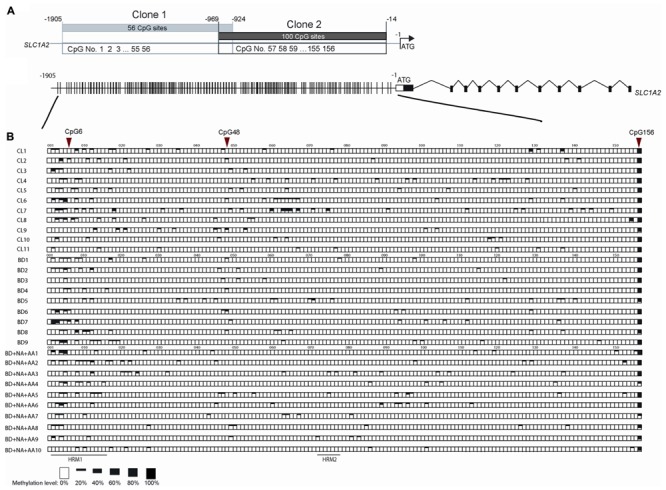
FIGURE 4.

The methylation pattern of individual CpG sites on SLC1A2 promoter region. (A) The profile of two clones in TA cloning and DNA sequencing method, shared 45 bp overlap, covered 156 CpG sites during –1905 to –14 of SLC1A2 promoter. (B) The gene profile of SLC1A2. Distribution of CpG sites on the proximal SLC1A2 promoter. The individual lines in the promoter denote each CpG site (Top panel). Sequences from multiple clones (n ≥ 5 from two replicate experiments for each condition) in each subject were examined. The methylation level of individual CpG sites in each subject from three groups including healthy control subjects (CL), bipolar disorder (BD) without alcohol abuse or dependence (AA), nicotine dependence (ND), and binge eating disorder or bulimia nervosa, and BD comorbid with ND and AA are shown in boxes (bottom panel). The average methylation percentages of individual CpG sites are shown in different size of black boxes. The empty box denotes 0% methylation level, while the total black box denotes 100% methylation level.
