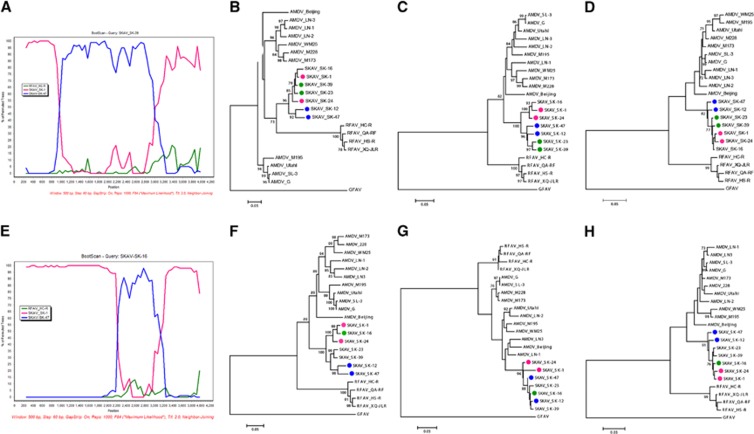
Figure 3.
Recombination analyses of SKAVs. The BootScan analysis is displayed for recombinant sequences SK-39 (A) and SK-16 (E). Trees built with partitions of the alignment between breakpoints are illustrated in B (nt 69–1030 of the SKAV_SK-1 complete genome), (C) (nt 1031–3192) and (D) (nt 3193–4225) for the first recombination event and (F) (nt 69–2332), (G) (nt 2333–2993) and (H) (nt 2994–4225) for the second. The evolutionary histories were inferred with the maximum-likelihood method19 based on the GTR (B, C and F), HKY (D and G) and TN93 (H) plus gamma models.29, 30, 31 Putative recombinant sequences are indicated by green dots, the possible minor parents by blue dots and the possible major parents by pink dots.

