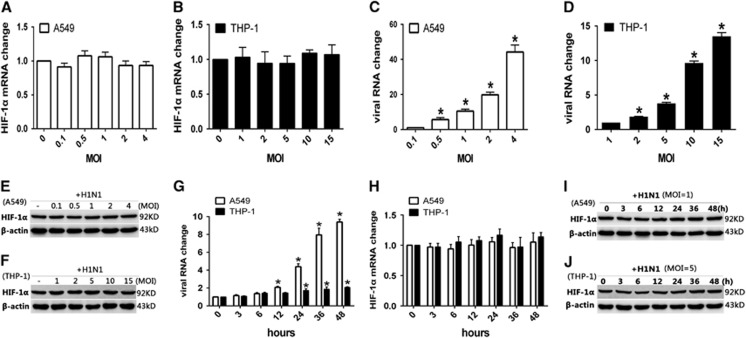
Figure 1.
The change in HIF-1α mRNA and total protein levels in H1N1-infected A549 and THP-1 cells. (A–F) PBS (control) or A549 and THP-1 cells infected with H1N1 at MOIs of 0, 0.1, 0.5, 1, 2 and 4, and 0, 1, 2, 5, 10 and 15, respectively. After 24 h, the cells were collected. (G–J) A549 and THP-1 cells were treated with PBS (control) or infected with H1N1 at MOIs of 1 and 5, respectively. At 3, 6, 12, 24, 36 and 48 h, cells were collected. (A–D, G and H) Total cellular RNA was extracted and HIF-1α mRNA levels and viral RNA levels were measured by qRT-PCR. β-actin expression was used as an internal control. (E, F, I and J) Cell lysates were subjected to Western blot analysis using antibodies against HIF-1α. β-actin expression was used as a loading control. Data shown are the mean±SEM of three independent experiments. *P<0.05 compared to the first infected group.

