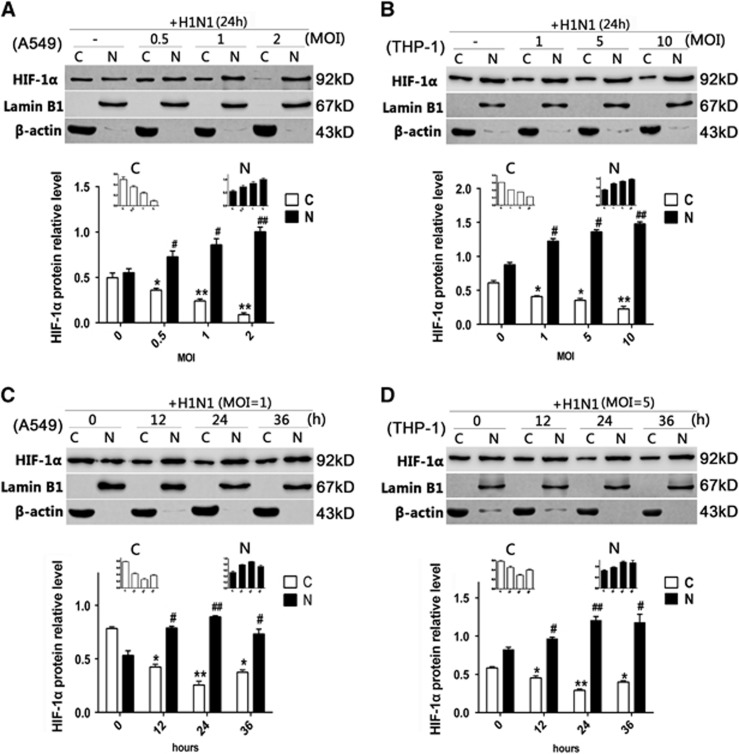
Figure 3.
The cytoplasmic and nuclear protein levels of HIF-1α in H1N1-infected A549 and THP-1 cells. (A and B) A549 and THP-1 cells were treated with PBS (control) or infected with H1N1 at MOI values of 0, 0.5, 1 and 2, and 0, 1, 5 and 10, respectively. After 24 h, cells were collected. (C and D) A549 and THP-1 cells were treated with PBS (control) or infected with H1N1 at MOIs of 1 and 5, respectively. After 12, 24 or 36 h, cells were collected. Nuclear and cytoplasmic extraction reagents were used to extract the nuclear and cytoplasmic proteins from the cells. Western blot analysis was performed. β-actin was used as a loading control of cytoplasmic protein (abbreviated as ‘C’ in the figure), and lamin B1 was used as a loading control of nuclear protein (abbreviated as ‘N’ in the figure). The intensities of the protein bands from three typical experiments were quantified using Image J software. The data are shown as the mean±SEM of three independent experiments. *P<0.05, **P<0.01 compared with the cytoplasmic protein from the control group. #P<0.05, ##P<0.01 compared with the nuclear protein from the control group.

