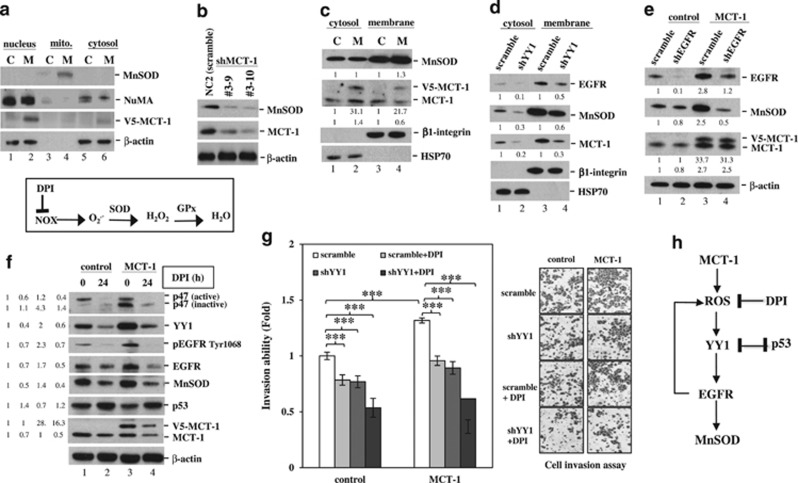
Figure 5.
MCT-1 induces MnSOD expression and promotes cancer cell invasion via the YY1 pathway. The A549 cancer cells were studied. (a) Subcellular distributions of MnSOD, NuMA, MCT-1 and β-actin in the nucleus, mitochondria (mito.) and cytoplasm were characterized in control (C) and MCT-1-overexpressing (M) cells. (b) MnSOD expression levels were examined in different MCT-1-silencing clones (#3–9 and #3–10) and scrambled knockdown (NC2). (c) The distribution of MnSOD and MCT-1 in the cytosolic and membrane fractions was studied. HSP70 and β1-integrin were the fraction markers. The amounts of cytosolic and membrane proteins were normalized to HSP70 and β1-integrin, respectively, and then compared with scrambled knockdown (lanes 1 and 3). (d) The effects of YY1 knockdown (shYY1) on the distribution of EGFR, MnSOD, MCT-1 and HSP70 in the cytosol and membrane were studied. The cytosol and membrane protein amounts were normalized to HSP70 and β1-integrin, respectively, and then compared with scrambled knockdown (lanes 1 and 3). (e) The effects of EGFR knockdown (shEGFR) on MnSOD and MCT-1 expression were assessed. The protein amounts were normalized to β-actin before comparison with scrambled control (lane 1). (f) The influence of DPI (an ROS inhibitor) on the expression of p47phox (active and inactive forms), YY1, EGFR, MnSOD and p53 was studied. The protein amounts were normalized to β-actin before comparison with the comparative control (lane 1). (g) Cell invasiveness affected by DPI treatment and YY1 knockdown was evaluated in different MCT-1 expression conditions. The data represent the mean±s.d. (n=3). ***P<0.001. (h) A proposed model of how MCT-1 overexpression promotes ROS generation and stimulates YY1-EGFR-MnSOD signaling, which can be suppressed by DPI and p53.

