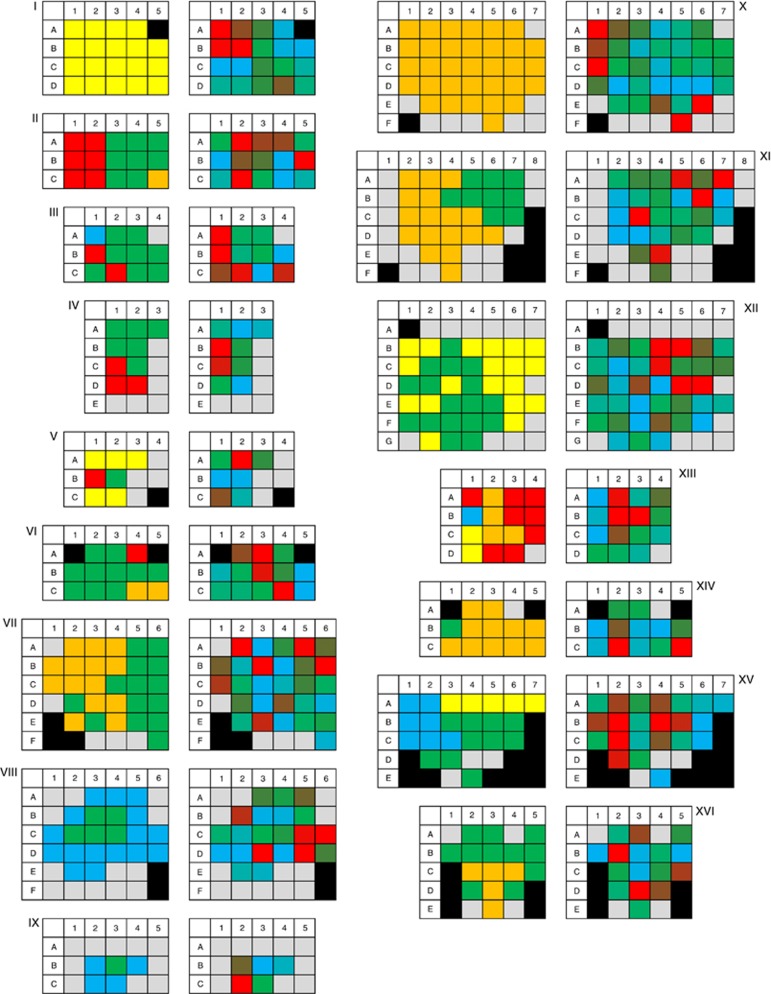
Figure 3.
Segmented analysis of a central tumour section of 16 adenocarcinoma (I–XVI). The left part of each diagram displays the predominant histological growth pattern in each tumour segment: blue – lepidic; green – acinar; yellow – papillary; orange – solid; red – micropapillary; grey – non-neoplastic tissue and black – no segment. The right side of the respective diagram represents the mtDNA copy numbers per nanogram total DNA in each tumour segment in gradual colour scales from blue (< 10% quantile) to green (50% quantile) to red (> 90% quantile); grey – non-neoplastic tissue and black – no segment. For absolute numbers see Supplementary 6.

