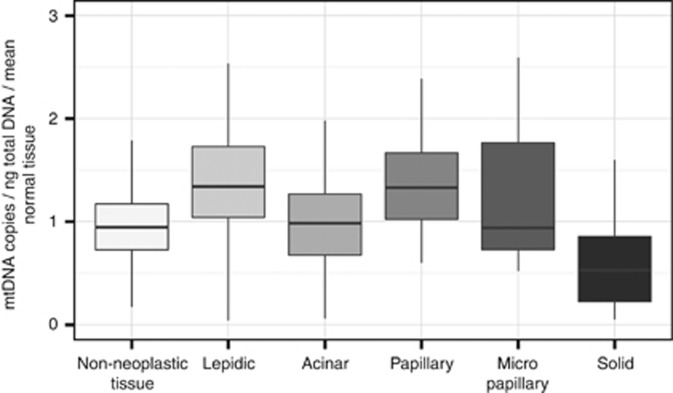
Figure 4.
Correlation of mtDNA copy numbers to the predominant histological growth pattern in segmented central sections of 10 ADC (Figure 3: IV, V, VII–XII, XV, XVI). Boxplots showing the median, interquartile range, minimum and maximum mtDNA copy number per ng total DNA normalised to non-neoplastic tissue.

