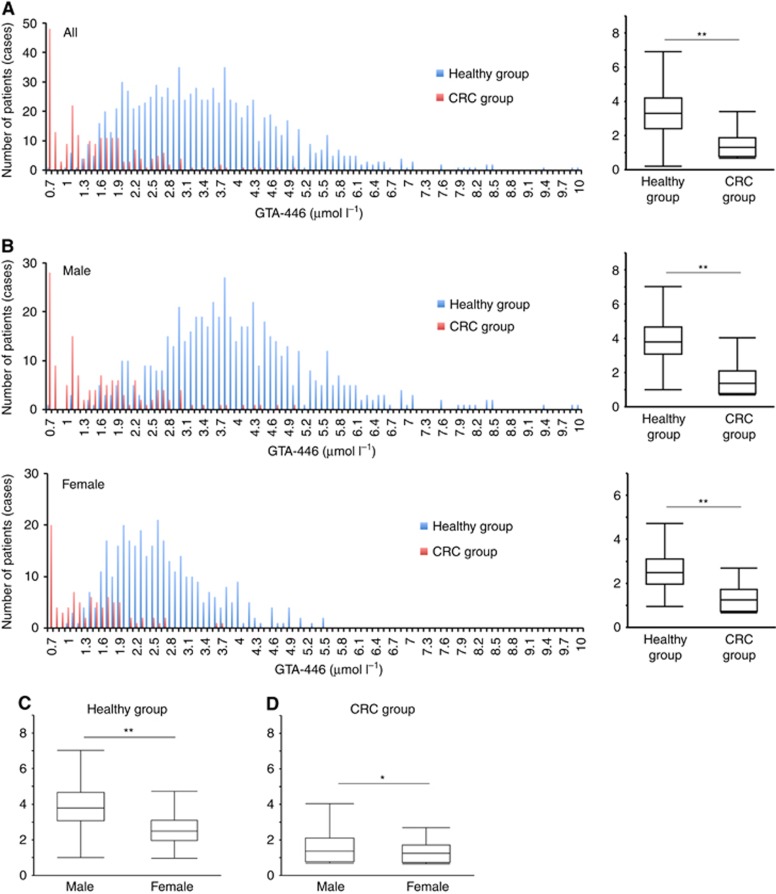
Figure 1.
Comparison of GTA-446 levels. (A) Left: distribution of GTA-446 levels in the control (blue) and CRC groups (red). Right: comparison of GTA-446 levels between the two groups. (B) Left: distribution of GTA-446 levels in both groups by gender (top, males; bottom, females). Right: comparison of GTA-446 levels between both groups by gender (top, males; bottom, females). (C) Comparison of GTA-446 levels in males and females in the control and (D) CRC groups. The box indicates the range from the first quartile (Q) to the third Q. The short horizontal line indicates the maximum value (upper) and the minimum value (lower) in the interval from 1Q− (IQR × 1.5) to 3Q+(1QR × 1.5) excluding outliers. IQR, interquartile range. *P<0.05, **P<0.0001.

