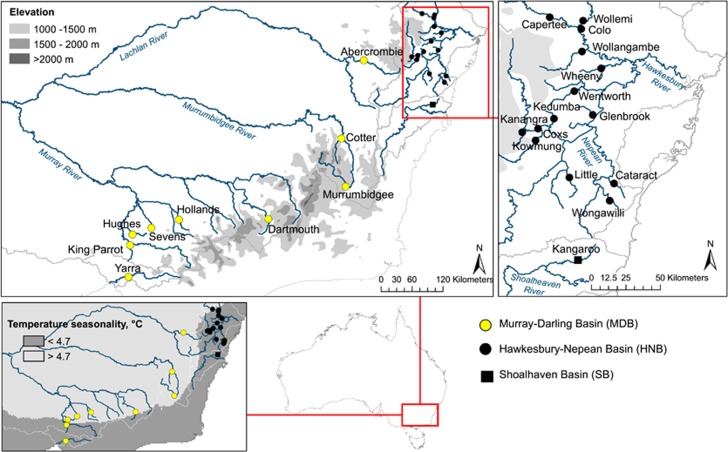
Figure 1.
Geographic distribution of Macquarie perch samples across Murray–Darling Basin (MDB; Yarra Basin population (Yarra) was established by translocations from the MDB), Hawkesbury–Nepean Basin (HNB) and Shoalhaven Basin (SB). Thin light grey lines show basin borders, shades of grey on top two maps show elevation of the Great Dividing Range. The bottom left map shows samples mapped over temperature seasonality (WorldClim variable BIO4/1000: s.d. of mean monthly temperatures). Cataract River contains native fish and fish translocated from the MDB; representative mitolineages of both are analysed here.

