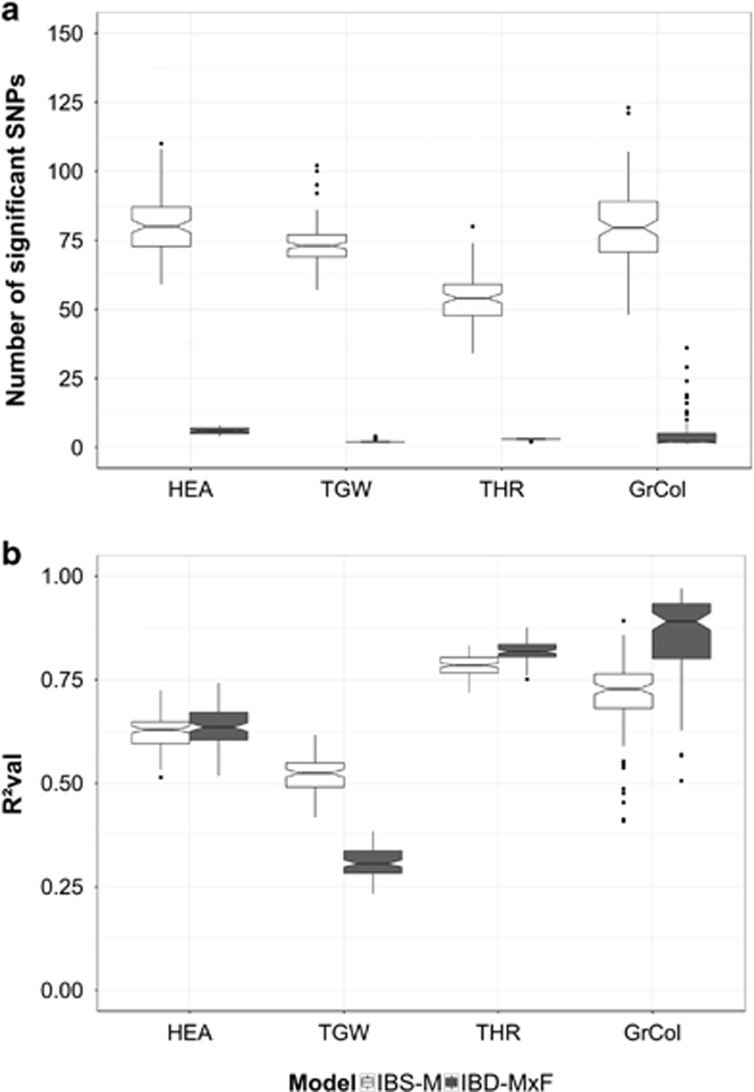
Figure 1.
Variation of number of significant SNPs (a) and variation of prediction ability (R2val) (b) in the barley NAM population. Box plots indicate the distribution across 100 cross-validation runs. Empty and filled boxes represent models ‘IBS-M’ and ‘IBD-M × F’, respectively. Traits are separated by columns.

