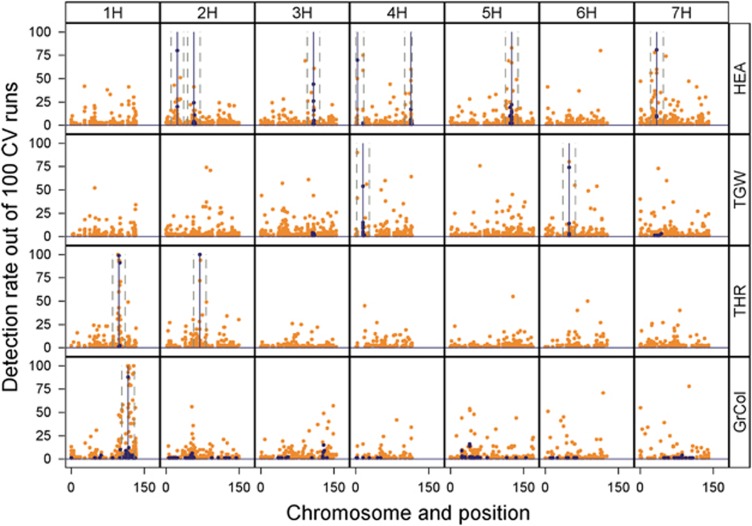
Figure 2.
Comparison of detection rates of significant markers across the genome between models ‘IBS-M’ and ‘IBD-M × F’ in the barley NAM population. Each of the four rows represents a different trait. The height of the peaks indicates the number of significant effects detected per SNP marker out of 100 cross-validation runs, ordered by genetic position according to the map of Maurer et al. (2015). Orange dots represent IBS-M, and blue dots IBD-M × F. Major QTLs detected by IBD-M × F are indicated by vertical lines. Dashed vertical lines indicate the 26 cM window used for cumulation.

