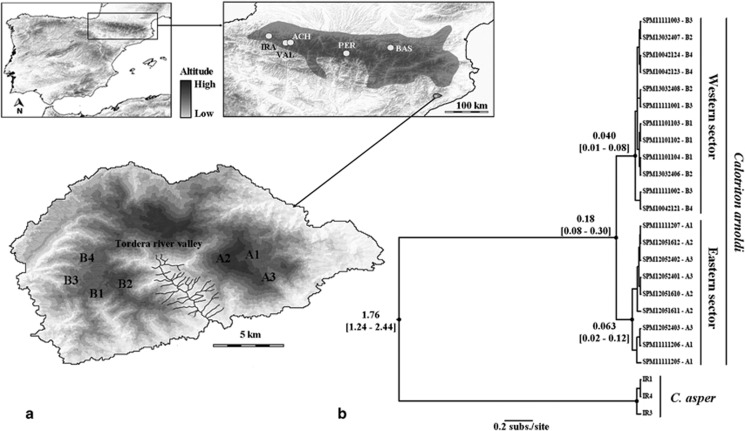
Figure 1.
(a) The distribution range of the Montseny brook newt, Calotriton arnoldi. Populations located in the eastern sector and in the western sector are separated by the Tordera river valley (Valbuena-Ureña et al., 2013). All localities have been sampled for this study. Shade indicates the actual distribution range of Calotriton asper. Locations of the C. asper populations used in this study are also shown (ACH: Ibón de Acherito; BAS: Bassies; IRA: Irati; PER: Ibón de Perramó VAL: Barranco de Valdragás). (b) Bayesian inference tree of Calotriton inferred using BEAST with the concatenated data sets. A list of details of all the specimens is presented in Supplementary Table S1. Black-filled circle indicates pp>0.95 in the BEAST analysis. Ages of some relevant nodes are shown by the nodes with the 95% HPD underneath between square brackets.

