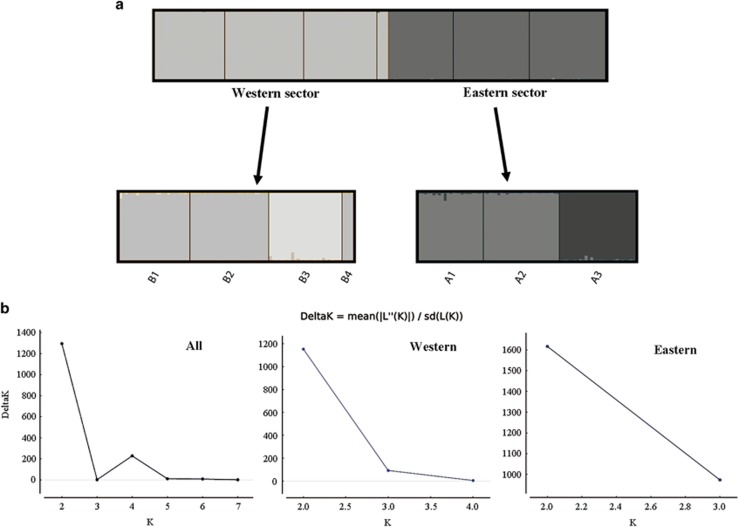
Figure 2.
(a) Results of Bayesian clustering and individual assignment analysis obtained with STRUCTURE after running the program with all populations (above) and by sector (below); vertical bars delimit sampling locations. (b) Inference for the best value of K based on the ΔK method among runs for all populations and by sector.

