
Figure 1.
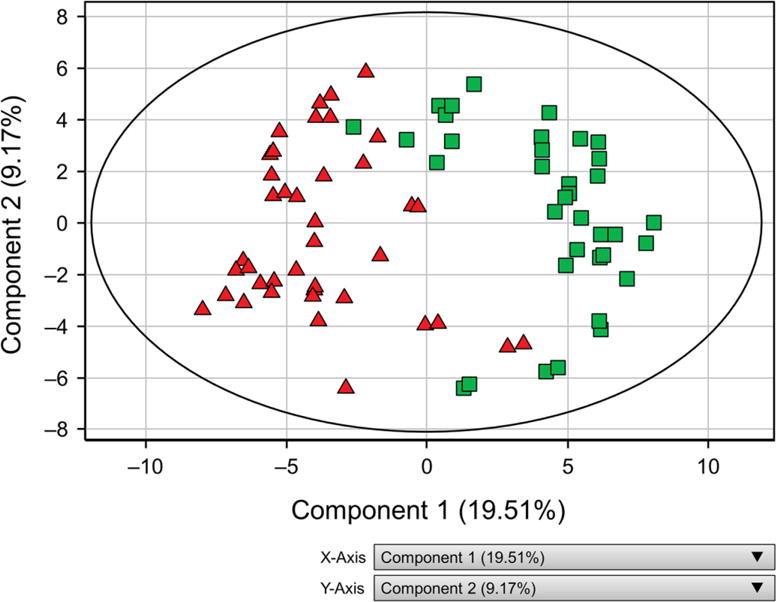
Two-dimensional Score Plot of Principal Component Analysis Showing Group Separation Between PCOS and MetS. Each person is represented by 2 replicate data points. PCOS and MetS groups can be seen in clusters separated on 2 components. The first and second components explained 18.51% and 9.67% of variations, respectively. MetS indicates controls with metabolic syndrome (green squares); PCOS, polycystic ovary syndrome (red triangles).