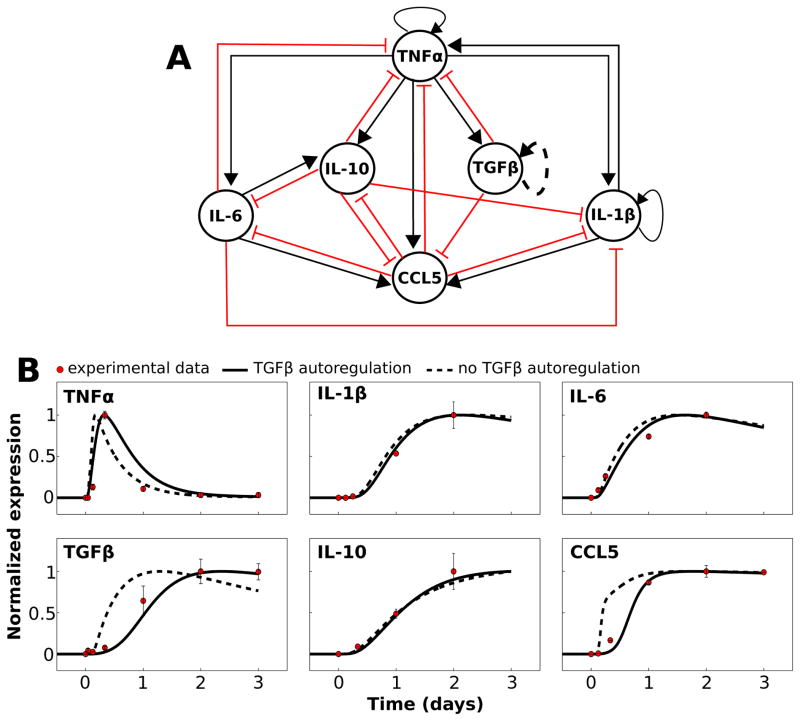
Fig. 1.
Network model and mathematical simulation of complex signaling dynamics involving pro- and anti-inflammatory cytokines. (A) The literature-based network model depicts activation and inhibition of cytokine production, respectively, with black arrows and red T-connectors. The dashed line representing the TGFβ autoregulation loop indicates that this interaction is hypothesized rather than demonstrated experimentally. All model species aside from TGFβ were activated by LPS in our simulations. (B) The results of our calibrated model are shown along with normalized experimental kinetic profiles. Simulations were performed in which a saturating stimulus of LPS = 1000 was applied at t = 0 and maintained throughout the simulation. Traces are shown with and without the TGFβ autoregulatory loop.

