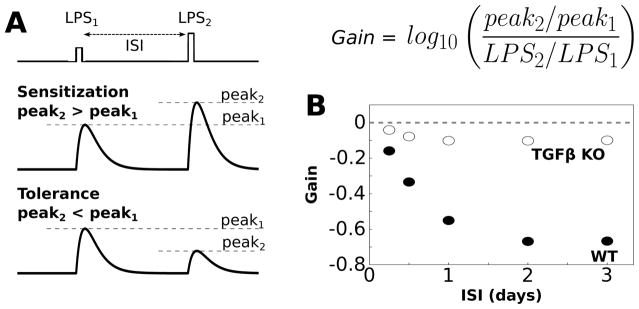
Fig. 3.
Simulations of endotoxin tolerance support model validity. (A) Tolerance is evaluated by applying two sequential LPS doses, separated by an interstimulus interval (ISI), where the first dose is smaller than the second dose (LPS1 = 500, LPS2 = 1000). In general sensitization occurs when the peak response to the second LPS dose is greater than the peak response to the first dose (gain>0, see equation). Tolerance occurs when the peak response to the second LPS dose is smaller than the peak response to the first dose (gain < 0). (B) Gain of the TNFα response to LPS was evaluated over a range of ISIs (2 h LPS pulse duration). For these simulations we set LPS = 0.1 during the ISI to maintain network coupling. Negative gain was observed for the wildtype condition for ISI > 6 h, thereby indicating tolerance. Simulated functional knockout (KO) of TGFβ resulted in the absence of negative gain, thereby eliciting sensitization.

