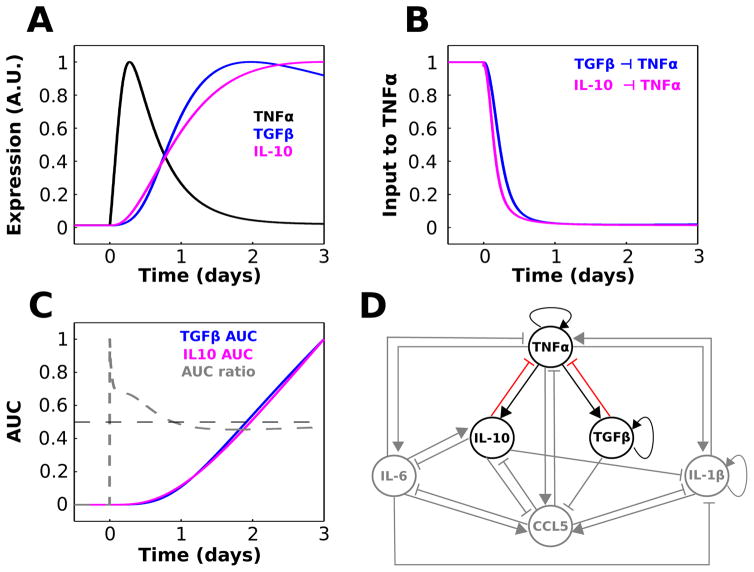
Fig. 4.
TGFβ and IL-10 provide temporally distinct feedback inhibition to TNFα. (A) Relative waveforms of TNFα, TGFβ, and IL-10 are plotted for comparison (LPS = 1000 starting at t = 0). (B) Normalized TGFβ and IL-10 contributions to the TNFα activation rate equation show that IL-10-mediated inhibition of TNFα precedes that of TGFβ. These quantities were computed as and . (C) Normalized area under the curve (AUC) was computed as a function of time for the TGFβ and IL-10 inputs to TNFα shown in panel A. The AUC ratio trace represents the fractional contribution of IL-10 relative to TGFβ: AUC ratio = AUCIL10/(AUCTGF + AUCIL10). (D) Cytokine interaction network where sensitive interactions that will be the focus of the remainder of the paper are highlighted.

