Fig. 6.
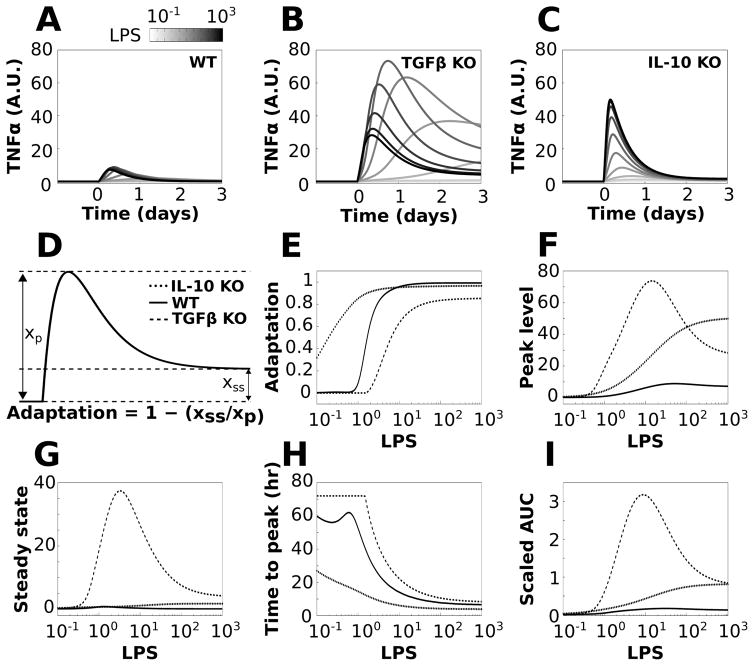
TGFβ and IL-10 have divergent effects on TNFα adaptation. Simulations were performed for a range of LPS doses in which LPS was applied continuously starting at t = 0 for the duration of the simulation. The effects of knocking out TGFβ or IL-10 were simulated by removing these nodes from the network. The reference simulation is referred to as WT and the knockouts are referred to as TGFβ KO and IL-10 KO. (A–C) Sample TNFα responses to LPS are shown across the range of stimulation levels for the WT (A), TGFβ KO (B), and IL-10 KO (C) phenotypes. (D) Adaptation was computed using the ratio of steady state to peak TNFα responses to sustained LPS applications (see equation). (E) Adaptation was computed for LPS inputs ranging from 0.1 to 1000 in all three model phenotypes. (F) Plots of maximal TNFα values show that KO of either feedback inhibitor increased the peak response to LPS. (G) The TNFα steady state response shows that TGFβ knockout markedly increases the TNFα steady state, whereas IL-10 knockout has a relatively minor effect. (H) The time from the initiation of the LPS pulse to the peak TNFα response (ttp) is shown for the three conditions. (I) Plots show the total amount of TNFα produced following LPS application, assessed by the area under the TNFα curve (AUC).

