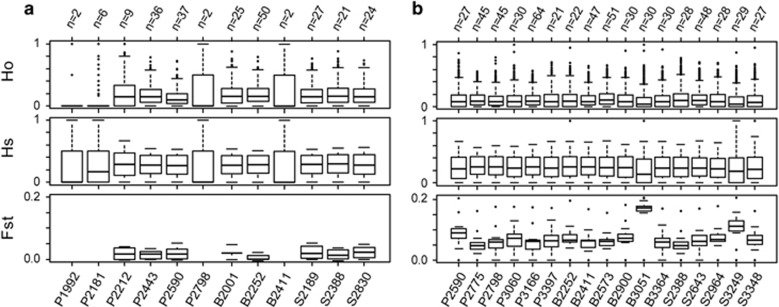
Figure 2.
Sample sizes and genetic diversity estimates by site for (a) B. tricaudatus and (b) B. bicaudatus. Site IDs indicate drainage (P, B or S) followed by elevation in meters. Plots of observed heterozygosity (Ho) and gene diversity (Hs) represent the distribution of heterozygosity for each site. Plots of pairwise FST represent the distribution of pairwise relationships for a given site with all other sites. Pairwise FST values were not computed for sites with low sample numbers (n⩽8). In general, B. bicaudatus populations show reduced genetic diversity and elevated pairwise FST, reflecting the combined effects of isolation, drift and local adaptation.

