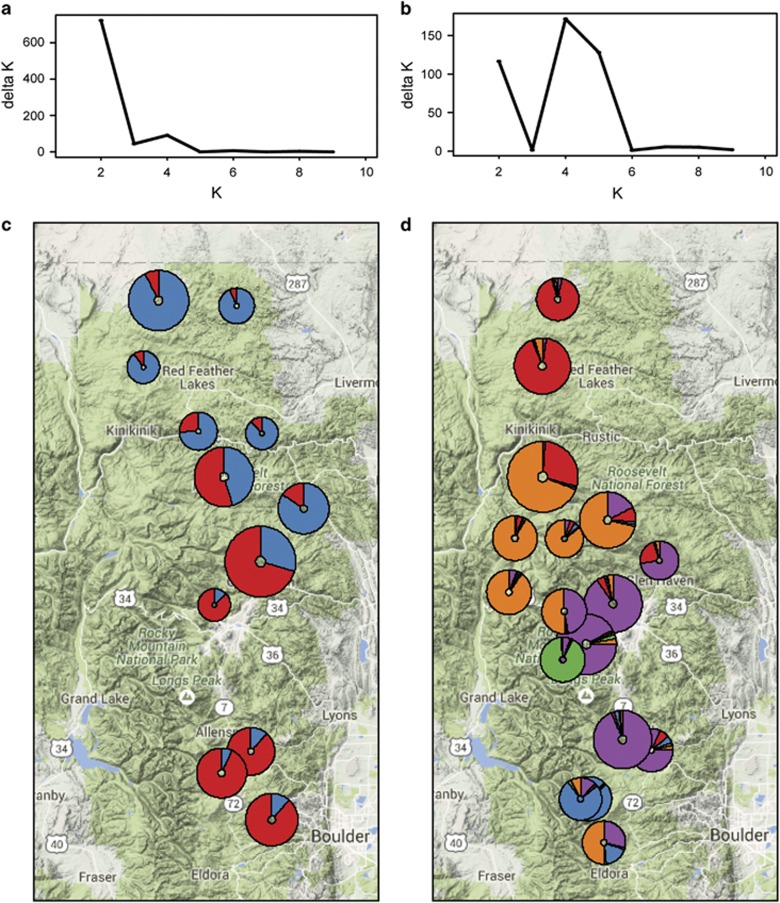
Figure 4.
Structure clustering results (upper panels) for (a) B. tricaudatus and (b) B. bicaudatus. Genetic clustering showed an optimum number of two clusters (K) for the B. tricaudatus data set and similar levels of support for four or five clusters in B. bicaudatus (K=5 shown in lower panel). The distribution of genetic clusters (represented by different colors, lower panels) over the landscape shows fewer population clusters in (c) B. tricaudatus distributed over wider geographic areas than those in (d) B. bicaudatus. Circle sizes are proportional to sample numbers for each species. Place names and road numbers are included on map for reference.

