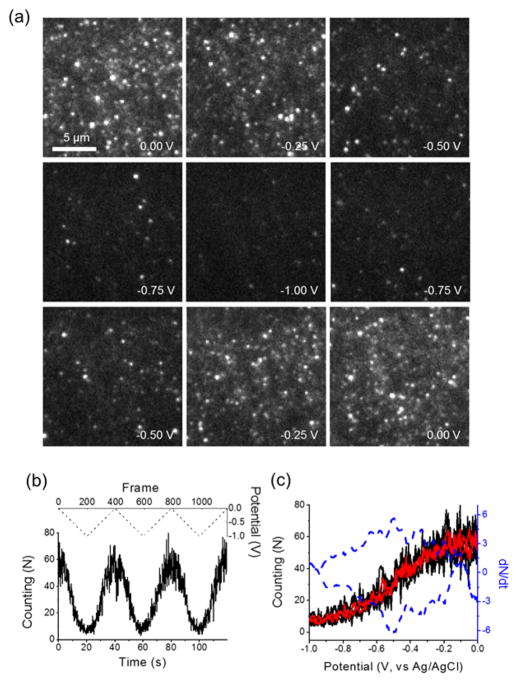
Figure 4.
(a) A series of fluorescence images captured over the potential sweep of 1 nM resorufin in 50 mM phosphate buffer (pH 7.4) and 1 M KCl solution on the silica-ITO electrode. The potential was cycled from 0 to −1 V versus an Ag/AgCl reference electrode at the scan of 50 mV/s. Image size is 16 μm × 16 μm. (b) The number of single molecular spots detected on each frame over three continuous potential sweeps (black solid). The potential waveform was shown in dashed line. (c) The plot of the number of single molecular spots detected on each frame (black) and averaged over three potential sweeps (red), and the time derivative (blue dashed) as a function of applied potential from 0 to −1 V.

