
Figure 9. The relationship between correct and confident responses in Experiment 3b: Randomized Response Order.
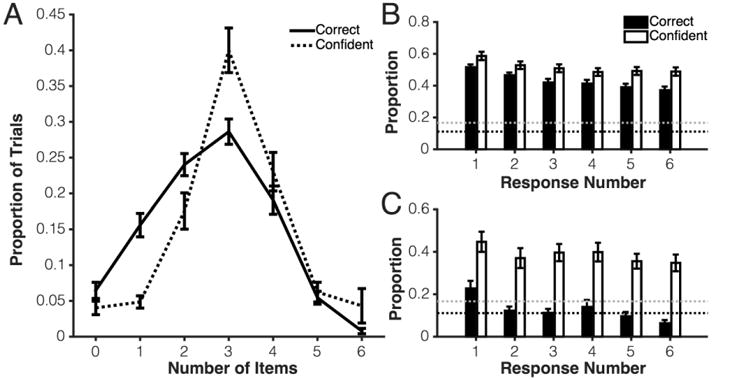
Error bars represent one standard error of the mean. (A) Dotted line: Proportion of trials where participants reported that they were confident about 0 though 6 items. Solid line: Proportion of trials where subject correctly reported 0 through 6 items. (B) Distribution of correct and confident responses across each response in time across all trials. Response Number = 1 represents the first item the subject reported. Response Number = 6 represents the last item the subject reported. The gray dotted line represents a “smart” guessing strategy of remembering the colors of 3 items and guessing only among the 6 possible non-remembered colors (1/6), and the black dotted line represents a “purely random” guessing strategy among all possible colors (1/9). (C) Distribution of correct and confident responses across each responses in time only for lapse trials (participants got a total of 0 or 1 items correct).