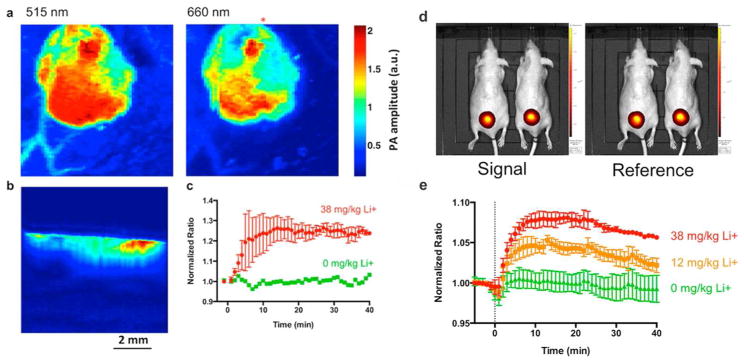
Figure 2.
Photoacoustic nanosensors imaged in mouse model. Dual wavelength images from photoacoustic tomography (a) clearly show the entire sensor injection. A depth profile (b) taken below the red asterisk in (a) shows the nanosensor injection in the tissue. The nanosensors respond to systemic lithium administration (c) has a time to peak concentration of 14 min. The images of both wavelengths (d) demonstrate the excellent imaging quality. The lithium kinetics (e) obtained from fluorescence measurement is similar to that measured with photoacoustics in a dose-dependent manner. Reprinted with permission from Reference 31. ACS Nano 2015, 9 (2), 1692–1698. Copyright 2015, American Chemical Society.

