
Figure 5. TM treatment leads to quantifiable lipid accumulation in the kidneys of Atf6α-/-but not wild-type animals.
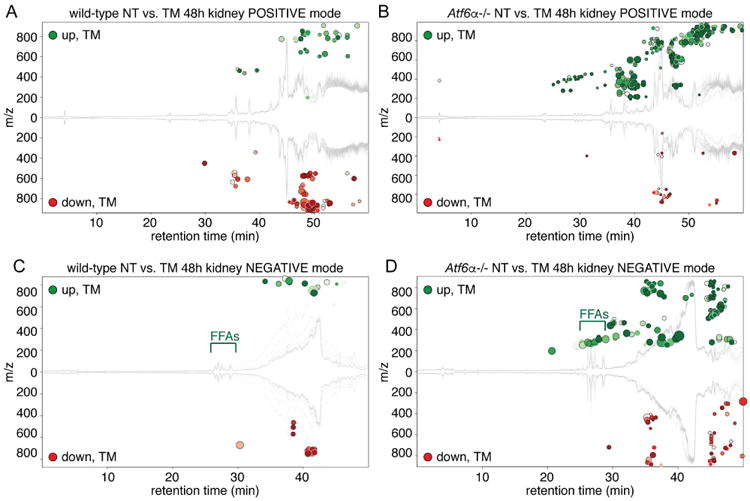
LC-MS in both positive and negative ion modes was used to profile the lipid distribution upon TM challenge in wild-type and Atf6α-/- animals. (A) and (B) show positive mode and (C) and (D) show negative mode. The response in wild-type animals is shown in (A) and (C), while the response in Atf6α-/- animals is shown in (B) and (D). XCMS software was used to generate cloud plots to provide a global view of species that were significantly different between groups. The x-axis shows retention time while the y-axis shows the mass-to-charge ratio, with species upregulated by TM shown in green above the midline and downregulated species shown in red below. The species shown are all those with a maximum intensity above 5,000 (i.e., to filter for reasonably abundant species) and an FDR-adjusted p-value below 0.01. Darker circles have lower (i.e., more significant) p-values, and the radius of each feature is proportional to the fold-change. Positon of FFAs is indicated. n=4. See also Figure S1.