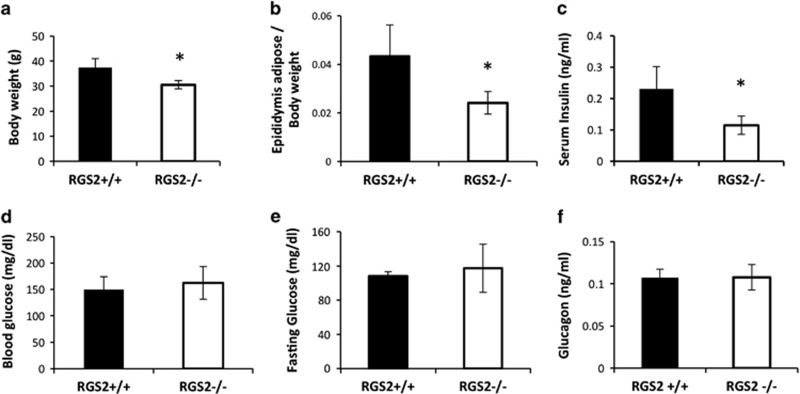
Figure 8.
Metabolic phenotypes of RGS2−/− and RGS2+/+ mice at 25 weeks of age. Body weights (a), ratio of epididymal adipose weight to body weight (b), serum insulin (c), fed (d) and fasting (e) insulin levels, and (f) glucagon levels in serum from 6-month-old RGS2−/− and RGS2+/+ mice (n=4 or 5 per group). *P<0.05, Student’s t-test

