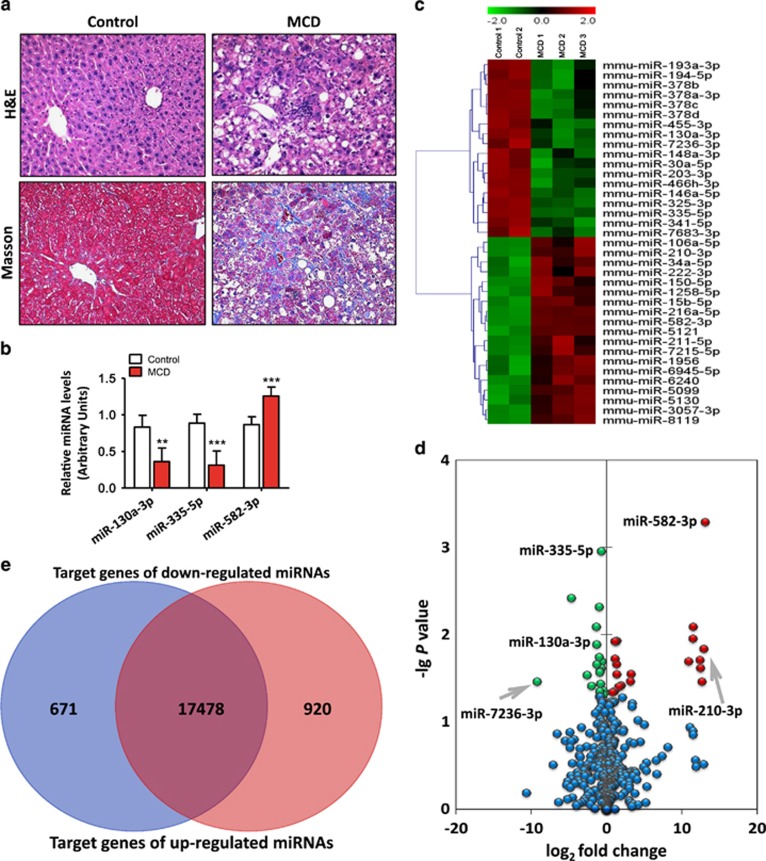
Figure 1.
Histopathological changes in liver sections, miRNA microarray data, and validation of the differentially expressed miRNAs in mice. (a) Histopathological changes in the liver sections of the mice fed the MCD and control diets. Hematoxylin and eosin staining (up) and Masson’s trichrome staining (down) ( × 200 magnification). (b) Validation of microarray data using qRT-PCR. Triplicate assays were done for each RNA sample and the relative amount of each miRNA was normalized to U6 snRNA. Values represent the mean±S.D., **P<0.01, ***P<0.001 compared with control. (c) A heatmap of the 37 most differentially regulated miRNAs of mice from the miRNA array of the control and MCD group. (d) A volcano plot demonstrating the profiles of the differentially expressed miRNAs for the MCD versus control groups. This plot illustrates the fold change (x axis) and significance level expressed as the log P-value (y axis). The green circles represent the miRNAs that were downregulated by the MCD diet compared with the control, and the red circles represent the miRNAs that were upregulated by the MCD diet compared with control. The blue circles indicate the miRNAs that were not significantly expressed. Significance was determined based on a P-value cutoff of 0.05 and a 1.3-fold change. (e) A Venn diagram illustrating the amount of target genes of the downregulated and upregulated miRNAs as predicted by the following five algorithms: TargetScan, miRanda, miRDB, PITA, and RNA22

