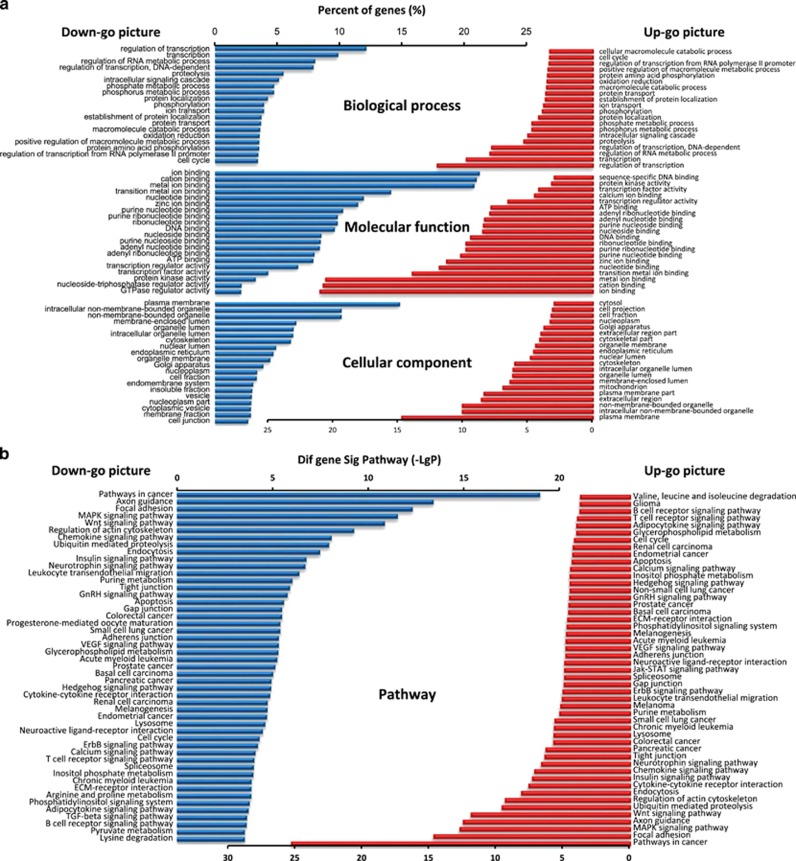
Figure 2.
Bioinformatics analysis of the predicted targets of all of the differentially regulated miRNAs. (a) GO category classification based on the predicted target genes of all of the differentially regulated miRNAs. The chart includes the GOs targeted by the underexpressed (left side) and overexpressed miRNAs (right side). The percentage of genes represents the number of genes annotated by the gene ontology database to the GO terms. Only the top 20 GO categories are shown for every ontology. The vertical axis is the GO category, and the horizontal axis is the enrichment of GO. (b) Pathway analysis was used to place the differentially expressed genes according to KEGG. The chart includes the pathways targeted by the underexpressed (left side) and overexpressed miRNAs (right side). Fisher’s exact tests were used to identify the pathways. Only the top 50 pathways with P<0.05 are shown. The vertical axis represents the pathway category, and the horizontal axis represents the value of –log P

