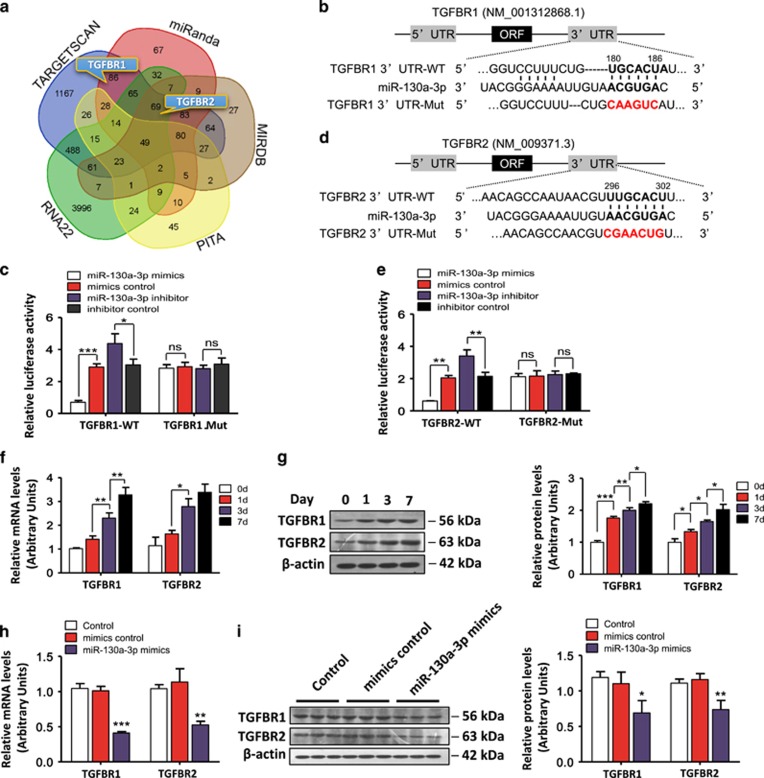
Figure 6.
Validation of TGFBR1 and TGFBR2 as target genes of miR-130a-3p. (a) A Venn diagram showing the overlap of the genes potentially targeted by miR-130a-3p as predicted by the following five algorithms: TargetScan, miRanda, miRDB, PITA, and RNA22. (b, d) The potential binding sites for miR-130a-3p on the 3′-UTRs of TGFBR1 and TGFBR2. (c, e) HEK293T cells were transfected with a luciferase reporter vector containing either the wild-type or mutant form of the 3′-UTRs of TGFBR1 and TGFBR2 in the presence of either the miR-130a-3p mimics, the mimics control, the miR-130a-3p inhibitor or the inhibitor control. The cells were assessed for luciferase reporter activity 48 h post transfection. Values represent the mean±S.D. (*P<0.05, **P<0.01, ***P<0.001). (f) The hepatic mRNA and (g) protein expression levels of TGFBR1 and TGFBR2 were increased during the process of HSC activation. β-actin was used as a loading control. Values represent the mean±S.D. (*P<0.05; **P<0.01; ***P<0.001). (h) The HSC-T6 cells were transfected with the miR-130a-3p mimics or mimics control for 48 h. The mRNA and (i) protein expression levels of TGFBR1 and TGFBR2 were reduced by the miR-130a-3p mimics in the HSC-T6 cells. β-actin was used as a loading control. Values represent the mean±S.D., *P<0.05, **P<0.01, ***P<0.001 compared with control. NS, not significant

