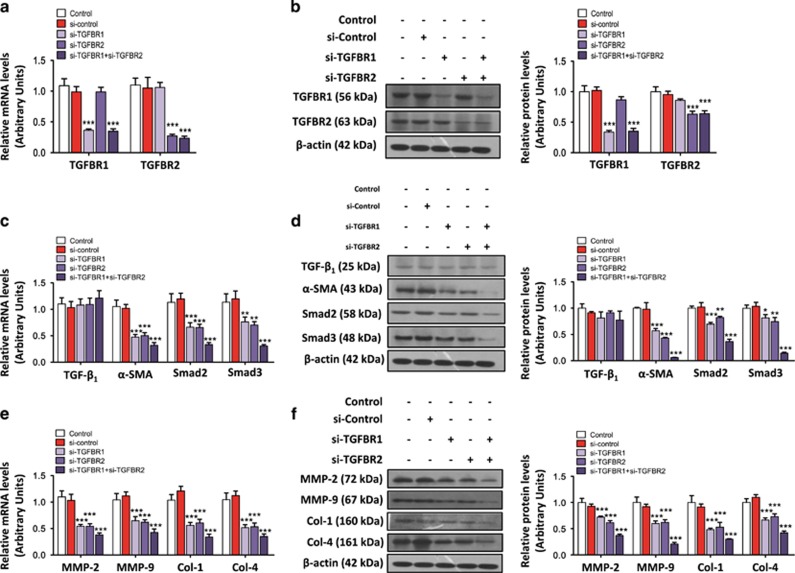
Figure 7.
Knockdown of either TGFBR1 or TGFBR2 inhibited the TGF-β/SMAD signaling pathway and reduced HSC activation. (a) Knockdown of TGFBR1 and/or TGFBR2 inhibited the mRNA and protein expression levels (b) of TGFBR1 and TGFBR2. β-actin was used as a loading control. Values represent the mean ±SD, ***P < 0.001 compared with control. (c) Knockdown of TGFBR1 and/or TGFBR2 inhibited the mRNA and protein expression levels (d) of α-SMA, Smad2, and Smad3. β-actin was used as a loading control. Values represent the mean ±SD, *P<0.05, **P<0.01, ***P<0.001 compared with control. (e) Knockdown of TGFBR1 and/or TGFBR2 inhibited the mRNA and protein levels (f) of MMP-2, MMP-9, Col-1, and Col-4. β-actin was used as a loading control. Values represent the mean±S.D., ***P<0.001 compared with control

