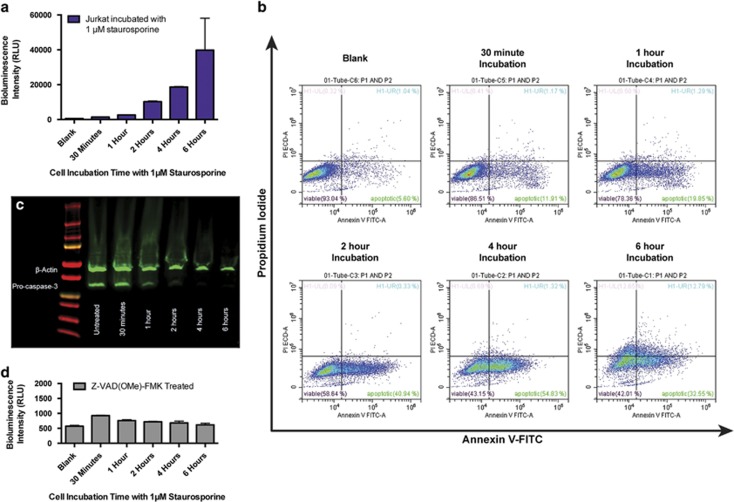
Figure 4.
(a) Bioluminescence response of ArFP incubated with Jurkat cells after treatment with 1 μM staurosporine for various times. Bioluminescence intensity reported as the mean of three measurements±one S.D. Error bars that are not visible are obstructed by the data point. (b) Flow cytometry analysis of Jurkat cells following treatment with 1 μM staurosporine for various times and dual stained with Annexin-FITC (FL1, 525/40 band pass filter) and the vital dye PI (FL11, 610/20 band pass filter) (Data acquisition: 2 × 10⁴ events per sample). (c) Western blot analysis of Jurkat cell lysates following treatment with 1 μM staurosporine for various times. (d) Bioluminescence response of ArFP incubated with Jurkat cells treated with 25 μM caspase inhibitor Z-VAD(OMe)-FMK followed by treatment with 1 μM staurosporine for various times. Bioluminescence intensity reported as the mean of three measurements±one S.D. Error bars that are not visible are obstructed by the data point

