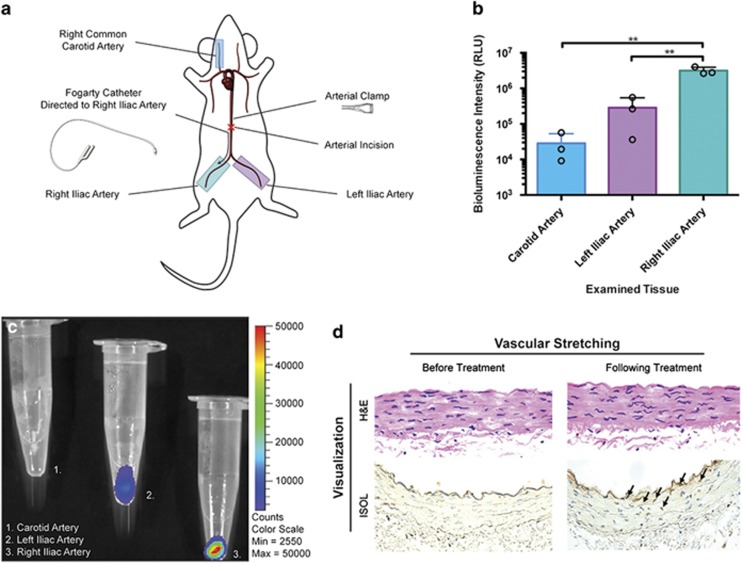
Figure 5.
(a) Diagram of operational procedure, illustrating position of treated and collected tissues (teal: right iliac/treated condition, purple: left iliac/reperfusion control, blue: carotid/healthy control). (b) Luminescence comparisons of treated (teal) and untreated (purple) iliac arteries as well as the carotid (blue) artery as a healthy control, performed in triplicate. (c) IVIS image of the carotid (1), left iliac (2), and right iliac (3) arteries after treatment. (d) Histological analysis of treated vascular tissue indicating the emergence of apoptotic cells following treatment

