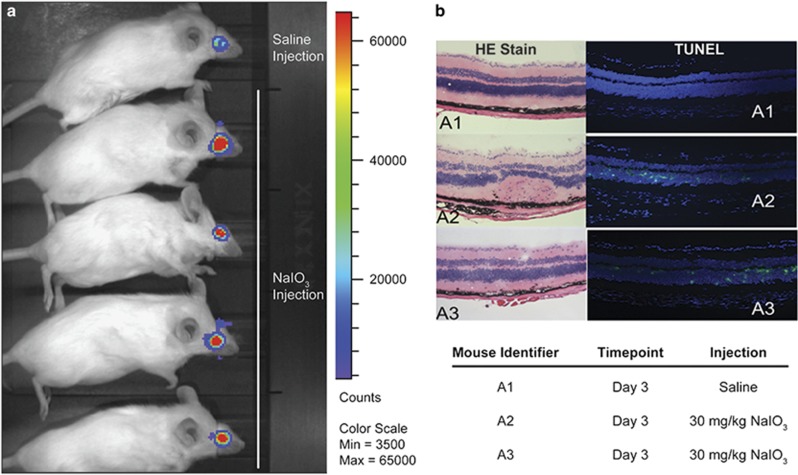
Figure 7.
(a) IVIS analysis of bioluminescence comparing control (saline injection) and retinal degeneration model (NaIO3 injection) mice. (b) Histological analysis of retinal sections from control (a1, PBS injection) and retinal degeneration model (a2 and a3, NaIO3 injection) mice. Left: H&E stain of retinal cross sections. Right: TUNEL analysis of retinal cross sections indicating presence of apoptotic (green) and non-apoptotic (blue) nuclei

